What could go wrong in today’s financial world? Many stock markets in the West are hitting new highs, and central banks are promising they will do nothing to spoil the party. But as Gillian Tett of the Financial Times warned on Friday:
“Before anyone gets too thrilled about equities, they should read a sobering research document from a corner of the US Treasury known as the Office of Financial Research. Ted Berg, an OFR analyst, has studied the history of American stock markets, and concludes the S&P 500 is nearing a “two sigma” (or two standard) deviation away from the historic norm. In plain English, his charts imply that markets are in bubble territory, comparable to patterns seen in 1929, 2000 and 2007.
“The indication, then, is that a big correction-cum-crash looms; indeed, Mr Berg thinks the situation is so fragile that the OFR report has the provocative title “Quicksilver Markets”.
Tett, of course, was one of the few reporters to warn loudly and clearly ahead of the 2008 financial crisis, being named Journalist of the Year as a result. And the “Quicksilver Markets” report is important because the OFR was created following the Crisis, with a mission to monitor threats to financial stability.
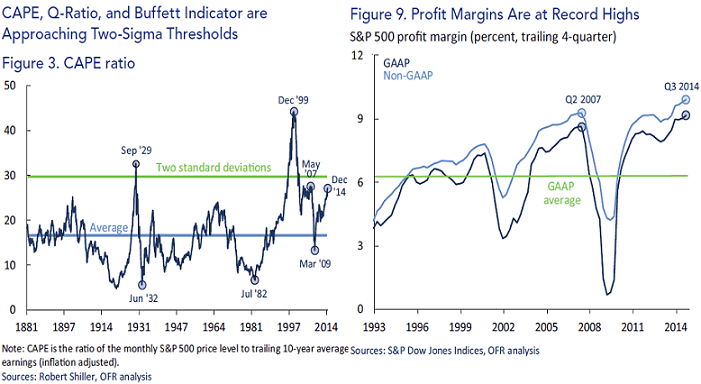
Mr Berg’s thesis is simple, that “Historically, periods of extreme valuations are eventually followed by large market price declines“. The 2 charts above highlight his point:
- Figure 3 highlights my own key indicator, Nobel Prize-winner Robert Shiller’s CAPE Index, which uses a 10 year cycle to measure the price/earnings ratio. It is now approaching a 2-sigma deviation from its historical value – which Berg warns has been a feature of “each major stock market bubble of the past century“
- Figure 9 highlights how US corporate profits are now at record highs. Mr Berg points out that these are now at a record 9.4% for the S&P 500, nearly 50% higher than their historical average of 6.3%
The chart on the right above highlights an even more extreme valuation. Corporate profits after tax at an all-time high versus normal Gross National Product, and at a 2-sigma deviation. As Mr Berg notes:
“Broadly speaking, systemic crises tend to be preceded by bubbles in one asset class or another…Four factors accelerate the emergence of asset bubbles: expansive monetary policy, lending booms, foreign capital inflows and financial deregulation”.
Of course, as we know only too well, the past 6 years have seen probably the most expansive monetary policy in history, with $22tn of quantitative easing/lending in the major economies. For the first time in history, central banks in Europe, the US and Japan have focused on boosting stock markets and thereby creating ‘wealth effects’, as their core mechanism for promoting economic recovery.
This in turn has led investors to assume that central banks will never let stock markets fall again.
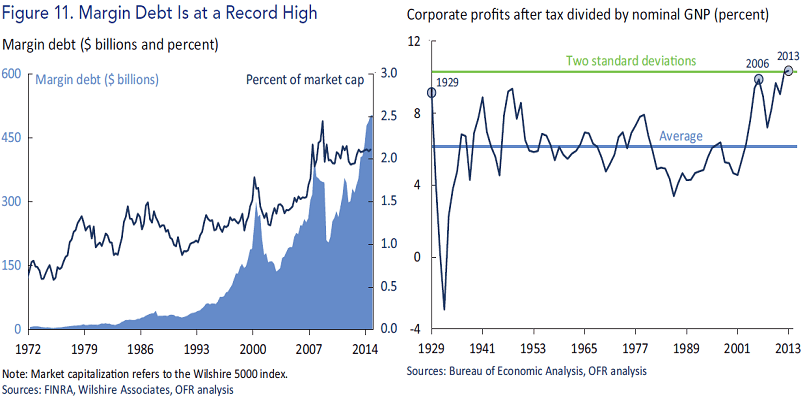
Thus, as Figure 11 shows, margin debt in the New York stock market is now at a record high. Essentially, the central banks have created a self-reinforcing policy, whereby they lend large amounts of money via QE at zero interest rates, which is then borrowed by investors for stock market speculation. In addition, as Berg points out, “corporations also have racked up a record amount of debt since the last crisis“, at $7.4tn versus $5.7tn in 2006. And he adds:
“Proceeds from debt offerings have largely been used for stock buybacks, dividend increases, and mergers and acquisitions. Although this financial engineering has contributed to higher stock prices in the short run, it detracts from opportunities to invest capital to support longer-term organic growth.”
Maybe, none of this type of analysis matters any more. Maybe the heads of today’s central banks have discovered the secret of constant growth, that has eluded alchemists in the past. But if not, then Berg’s conclusion is deeply worrying, given that he writes on behalf of the US Treasury watchdog set up specifically to monitor this issue:
“Quicksilver markets can turn from tranquil to turbulent in short order. It is worth noting that in 2006 volatility was low and companies were generating record profit margins, until the business cycle came to an abrupt halt due to events that many people had not anticipated.”
This is why I worry about the debt-fueled faultines of the ‘Ring of Fire’ created by the central banks. We know that China’s New Normal policies mean it is now heading in a new direction. And the deflation resulting from this development creates a toxic combination with debt, as we note in the latest pH Report.
WEEKLY MARKET ROUND-UP
My weekly round-up of Benchmark prices since the Great Unwinding began is below, with ICIS pricing comments:
Benzene Europe, down 56%. “Spot prices saw further downward movement over the course of the week.”
Brent crude oil, down 48%
Naphtha Europe, down 44%. “Supply and demand are balanced in northwest Europe”
PTA China, down 40%. “China’s Zhejiang Yuandong will stop production at its PTA facility after filing bankruptcy due to huge losses. The company is able to produce 3.2m tonne/year of PTA, with effective capacity since last year standing at around 2m tonnes/year. Impact on the market has been kept limited, as PTA remains an oversupplied product in Asia.”
HDPE US export, down 23%. “Domestic export prices held steady this week”
¥:$, down 17%
S&P 500 stock market index, up 8%