Key Features
Home Page
How do I set up News on my home page?
ICIS News teams around the world are reporting breaking news stories that impact chemical and energy markets, influence commodity prices and affect business decisions daily.
All news available via your subscription appear on your home page news feed. You can refine this list further by selecting to filter this list by the commodities you’ve selected in your Quick links.
How do I set up my Price Watchlist on my home page?
The Price Watchlist is the quickest way to check if the prices of your commodities have shifted and by how much. You can create your Price Watchlist by clicking the + icon at the top of the Watchlist. This will display a list of all price series you have access to. You can either scroll through the list or search for a price series by name.
To change the order of the prices on your Watchlist, click and hold the price tile and drag it up or down the list.
To remove a price series, just click the bin icon on the right-hand side of the price tile.
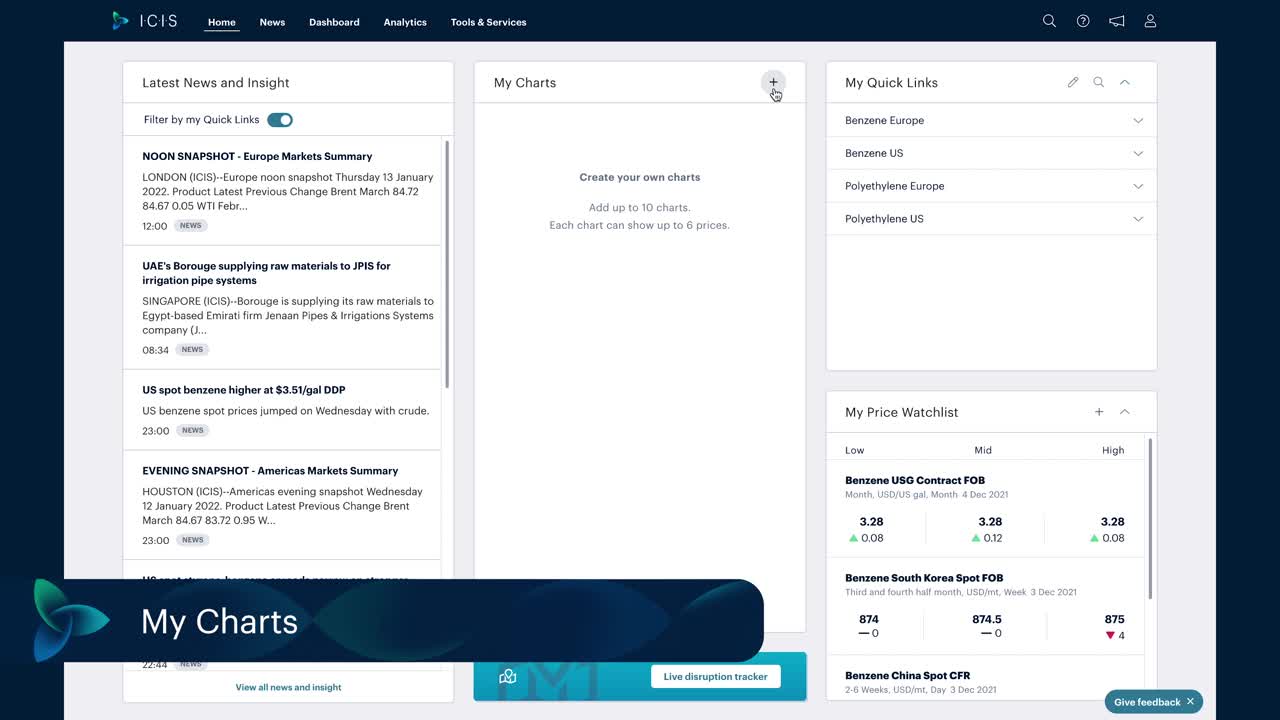
How do I set up charts on my home page?
Through your charts, you can customise a space that lets you track the trends across multiple price series for the markets you care about. To create a new chart, click the + icon at the top of the Watchlist. Click the plus icon (+) on the left or right axis to begin adding prices. Search and add the prices to build the charts you need. You can add up to 10 charts, create dual axes charts and add up to six price series, making them even more powerful. When you’re happy with your chart, click ‘Done’ to save it.
You can change the order of the charts in the My Charts widget by clicking and holding the chart tile and dragging it up or down the list.
To remove a chart from your My Charts widget, click the bin icon which will appear when you hover your cursor over the chart.
Can I change the items which appear in my news feed?
The news feed is your window to access market-moving intel, updated round the clock by a global team of industry experts. To focus on the news that matters to you, go to the top of your news feed and you’ll see the words ‘Filter by my Quick links’. Click on this and you’ll see the list updated to show only relevant news items that correspond to the commodities you selected in your Quick links.
You will need to create some Quick links (a collection of your favourited commodities) first for this function to work.
For instructions on how to do this, see ‘How can I customise my Quick links?’ below.
How can I save news articles?
On the home page, hover over an article. Click the ‘Add to reading list’ link that appears to save the article. You can access the reading list from the ICIS News Channel.
How can I customise My Commodities?
My Commodities are a collection of your favourited commodities.
You can start customising them by searching for the commodity you want to access by clicking the magnifying glass icon at the top of the My Commodities widget. A search box will appear with a list of commodity pages, each with a + icon next to it. Click the + icon to add a commodity page to My Commodities. When you’re done, click ‘Close’ and your changes will be saved automatically.

For the commodities you follow less often, or don’t need or want to store in your personalised list, you can return to your results list and click the commodity name to visit the commodity page directly.
To remove a My Commodity link, click the pencil icon at the top of the panel, then click the bin icon next to any Quick link you wish to remove. Click ‘Done’ when you’ve finished.

How can I customise my view?
To change prices or charting on your home page, click on the wheel icon to display a list of your entitled commodities to select from.
Scroll through to find the commodity you want to display; you will need to expand the commodity name to view all prices. Then you can toggle on for the commodities you want displayed.
ICIS News
How do I refine my news feed?
You can refine and filter your news search results by region and within a specific date range. The filters will be remembered from session to session.
If you have active filters, the filter icon will appear on your news feed.
How do I filter news articles by region?
You can either select one or more region filters or include the region as part of your search phrase (for example, Benzene Europe).
Why am I seeing pharmaceutical and bio technology news articles in my News stream?
Pharmaceutical and bio technology news stories are sourced by a third party Chemical Business Newsbase (CBNB). If you do not want to see these within the News stream make sure the check box for this within Alerts & Settings is unchecked.
How do I save searches?
After completing a search within the News page click the ‘Save this Search’ button and you will be prompted to enter a name for this search.
To view the output of this saved search view the ‘Saved Searches’ tab.
The ability to save searches is only available for full news subscribers.
How many searches can I save?
You can save 20 searches.
How do I download the latest issue of ICIS Chemical Business – ICB?
Next to each issue there is a ‘Download’ button. Clicking this will quickly download the issue which you can read offline.
How far back can I access ICIS Chemical Business – ICB?
The archive is available from July 2007 for each issue of ICIS Chemical Business – ICB
You can also access all articles through the search function using key word searches.
Commodities
How do I access my reports?
You’ll be able to access your reports via the dedicated Commodity Page, these are accessible via the home page.
You can also configure your email alerts to receive notification whenever a new report is published – a link within the email will direct you to the website from where you can access your chosen report.
Where can I find my weekly and daily reports?
For Petrochemical commodities, the weekly publications can be found in the Pricing & Insight tab on the commodity pages.
If a commodity page has an associated daily report, it will be found in the Daily Pricing tab. As this will be the most frequently updated page, this is the first page a user will see when opening the commodity page.
For Gas and Power, the daily report is found in Pricing and Insight tab.
If unsure, the date of publication can be seen on the top left of the pages.
How do I download a report?
Easy! Just go to the relevant Commodity Page(s) from where you can conveniently export or download your chosen reports.
How do I access archived reports?
Yes, access to archived reports is available within the Commodity Pages.
How do I set favourites?
You can easily configure the ICIS.com home page to set favourites / view favourite commodities and at-a-glance pricing – simply look for the cog icon as highlighted in the screenshot below to set these up and configure the page as you wish.
Selecting View all will take you to a commodity summary page listing all the commodities available as part of your subscription. This will replace the Reports Channel within ICIS.com.
How do I search for a commodity using abbreviations i.e. PE / Polye?
Yes! Using the search bar on the ICIS.com Home page and throughout the website, which you can use to search for a given commodity – the search function will support most common abbreviations such as ‘PE’ or Polye.
How do I check for the latest prices on the commodities page?
Within each commodity page, there is a secondary navigation menu (as highlighted in the image below). If you select ‘Pricing & Insight’ from this menu, this displays the report, within here clicking on prices in the report you will navigate to latest published price table.
How do I find out about the very latest market activity and developments?
You can stay up to date with real-time breaking news and analysis from around the globe, for each commodity.
Access this via the secondary navigation News also via the right panel to view related commodity news.
How can I find the latest production changes and disruptions?
You may wish to try the Live Disruption Tracker, a powerful data visualisation which provides an up-to-date view of the global supply scenario for a given commodity (including disruptions). Available for a range of commodities, the tracker enables you to quickly evaluate whether a market is long or short, mitigate risks to supply availability and adjust pricing strategies – using a customisable, interactive interface.
Are Commodity Pages available on the ICIS App?
Yes, Commodity pages as well as the Homepage and News Channel are fully responsive, so you can access all of your content from any device. If you mainly access ICIS content from your mobile phone, we recommend to use the ICIS App.
What are the Price Driver Analytics Tools?
At-a glance Price Driver analytics help you monitor competition beyond your country and region in order to maximise your margin potential and optimise sales opportunities – featuring analysis and actionable commentary, they are available across a range of commodities and include widgets you can use to analyse Import parity, Arbitrage/ Netbacks, Substitution, Feedstock & Downstream trends.
What are the Margin Analytics Tools?
Margins Analytics are a powerful, at-a-glance analytics tool available for a range of commodities – they visualises the latest variable cost and margin data by feedstock and location.
What is the Price Optimisation Tool?
Price Optimisation is a digital tool intended to save you precious time gathering information – use it to immediately identify where and at what price level to buy or sell a given commodity. Available for a range of commodities, the tool visualises net price differences between regions and countries through an interactive, global map – helping you to prioritise your sales, source opportunities, justify your pricing strategies and assess competitive threats.
What are Supply & Demand Outlooks?
Supply & Demand Outlooks are available for a range of commodities providing a global, quarterly overview of market conditions for the previous three months plus ICIS expectations for the current quarter across key value chains.
How do I check the criteria ICIS applies to its price assessments for a given commodity?
Each Commodity has a specific methodology document. The methodology button is located above the ‘Commodity Overview’ and is also accessible via the ICIS compliance page.
Dashboard
How do I add a price to my Quotations for Home window?
Click the cog icon in the top right-hand corner of the quotation window to open quotation preferences. Check the commodities you would like to add, and press ‘Done’.


How do I change the currency, units or frequency?
Click on the cog icon in the top right-hand corner of the Price History window.
Change the currency, unit, date range and frequency as needed, once you’ve chosen the data you need to click ‘Update’.

How do I retrieve and plot historical data?
Click on the cog icon in the top right-hand corner of the Price History window.

Change the price quotations, currency, unit, date range and frequency as needed.

Once you’ve chosen the data you need to click ‘Update’.
How do I download price history data?
Click the download icon in the top right-hand corner of the Price History widget and Select ‘Excel’ or ‘CSV’ from the drop-down options.

How do I download a graph from the Price History window?
Yes: click on the download icon in the top right-hand corner of the Price History window. Select the image format in which you wish to download the graph.

How many workspaces can I add?
You can create 14 workspaces in addition to the home tab maximum of 15 workspaces. You can add up to 11 windows in each workspace.
What is displayed in the price history window?
Price updates for the commodity prices selected in the quotations window.
The date range is defaulted to 12 months, you can change this via the settings.
How many quotes can I select to view in the quotations window?
You can select up to 100 quotes from your Quotation Preferences window which will be transferred to your main Quotations window. From there you can then select up to 10 quotes to display on the price history graph and download.
How can I delete multiple quotations?
Navigate to quotations preferences. Here, you can click on ‘View selected quotes only’ and can then select multiple quotes, unticking to delete.
On the quotations for home widget, clicking the ‘x’ will delete single quotes only.
How do I download more than 10 quotations in Excel?
You can select up to 100 quotes from your Quotation Preferences window which will be transferred to your main Quotations window. From there you can then select up to 10 quotes at one time.
If you are managing high volumes of pricing data and downloads our Excel Plugin is smart alternative – click here for more details including how to download and install.
Is there a quick way from the Dashboard to view the commodity page?
Yes, clicking the clipboard icon you can view the commodity page with latest pricing and insight.

How do I customise my own workspace?
Next to the home tab you will see a ‘+’ icon.
Click the ‘+’ then ‘Add a Blank Workspace’. There are pre-defined price driver analytic workspaces you can add but select ‘Blank’ to customise your own.
Click ‘+’ then ‘Add data to workspace’ to select to which workspace you want to add quotations for prices, Price History for graphs.
You can add 11 widgets in total but only one Quotations widget can be selected.
Why isn’t the data I selected displaying in the Price History window?
Click on ‘Link to selected quotations’ in the Price History window.

Once quotations are linked, the chain link will appear closed and the data will appear in the corresponding window.

How do I move workspaces?
You can move tabs by dragging and dropping them.
Please note that the home tab is fixed.
How many additional windows can I create per workspace?
You can add up to 11 windows.
How do I move the windows?
You can move the windows by dragging and dropping. If you add a Quotations window to a workspace, this window will be fixed and appear at the top of the workspace.
What are Price Driver Analytics Workspaces?
These are pre-defined workspaces you can add, they’re part of our analytics products. Each has been created and customised by our Editorial and Product teams.
For full details and specific FAQs available, click here
We do not currently offer this for all commodities.
How do I download data from the Price Driver analytics widgets?
The same download options for image and data are available on these widgets.
Can I edit the Price Driver analytics widgets?
No, this is not possible because the workspaces have formulas applied and are managed by our editorial experts.
For further details and available, click here