How digital infrastructure can help the chemical industry meet net zero targets
Emissions data: a business imperative

Chemicals and petrochemicals are the third-largest industrial subsector in terms of direct CO2 emissions, accounting for an estimated 920m tonnes of CO2 equivalent emissions each year. Together, they are responsible for around 3.6% of global greenhouse gas (GHG) emissions through energy used in production, and a further 2.2% from the use of fossil fuels as raw materials, or as a by-product of chemical processes.
The legislative response to climate change has been the imposition of increasingly robust reporting requirements. The EU’s recently enacted Corporate Sustainability Reporting Directive (CSRD) will mandate the reporting of Scope 3 emissions from across the supply chain, including many non-EU companies that until now have only reported on Scope 1 and 2. The SEC in the US is currently debating the introduction of more stringent requirements on climate-related reporting, including indirect and value-chain GHG emissions. And in the UK, requirements aligned with the Taskforce on Climate-related Financial Disclosures are now mandatory for larger companies and financial institutions.
The trading environment is changing too, and climate change and brand reputation are becoming inextricably linked. This is particularly relevant in the chemical industry, which is involved in the production of over 95% of manufactured goods. In a survey across seven major industrial nations in 2021, more than 80% of respondents said they regarded it as important or very important for corporations to commit to reducing their carbon emissions and achieving carbon neutrality.1 In addition, investor-led groups such as Climate Action 100+ have called for companies to publish their 2030 interim net zero goals.
With an increased need for reporting across the full chemicals value chain, the ability to provide accurate emissions data is fast becoming a business imperative. Being open to dialogue with trading partners on carbon reduction strengthens trading relationships and ultimately translates into higher revenues.
BASF for example, the largest global chemicals producer, has positioned itself at the forefront of the carbon reduction agenda by harnessing digital infrastructure. In 2021 it became the first chemical company to provide a carbon footprint for each of its 45,000 sales products, noting that its products “help GM to meet key sustainability targets such as a smaller carbon footprint and water and energy savings, at two of its plants.” BASF now regularly appears in the Forbes Top 100 of Global Sustainable companies.
With longer-term trends favouring lower carbon-intensive products, chemical producers need accurate emissions data to inform their modelling before investing in new plants and technology catering for demand up to 30 years from now.
1 (Oliver Wyman Forum, April 2021)
The scale of the challenge
For chemical and petrochemical producers, supply chain can contribute more to overall carbon footprint than energy use and processes combined, constituting, on average, more than 80% of overall emissions.2

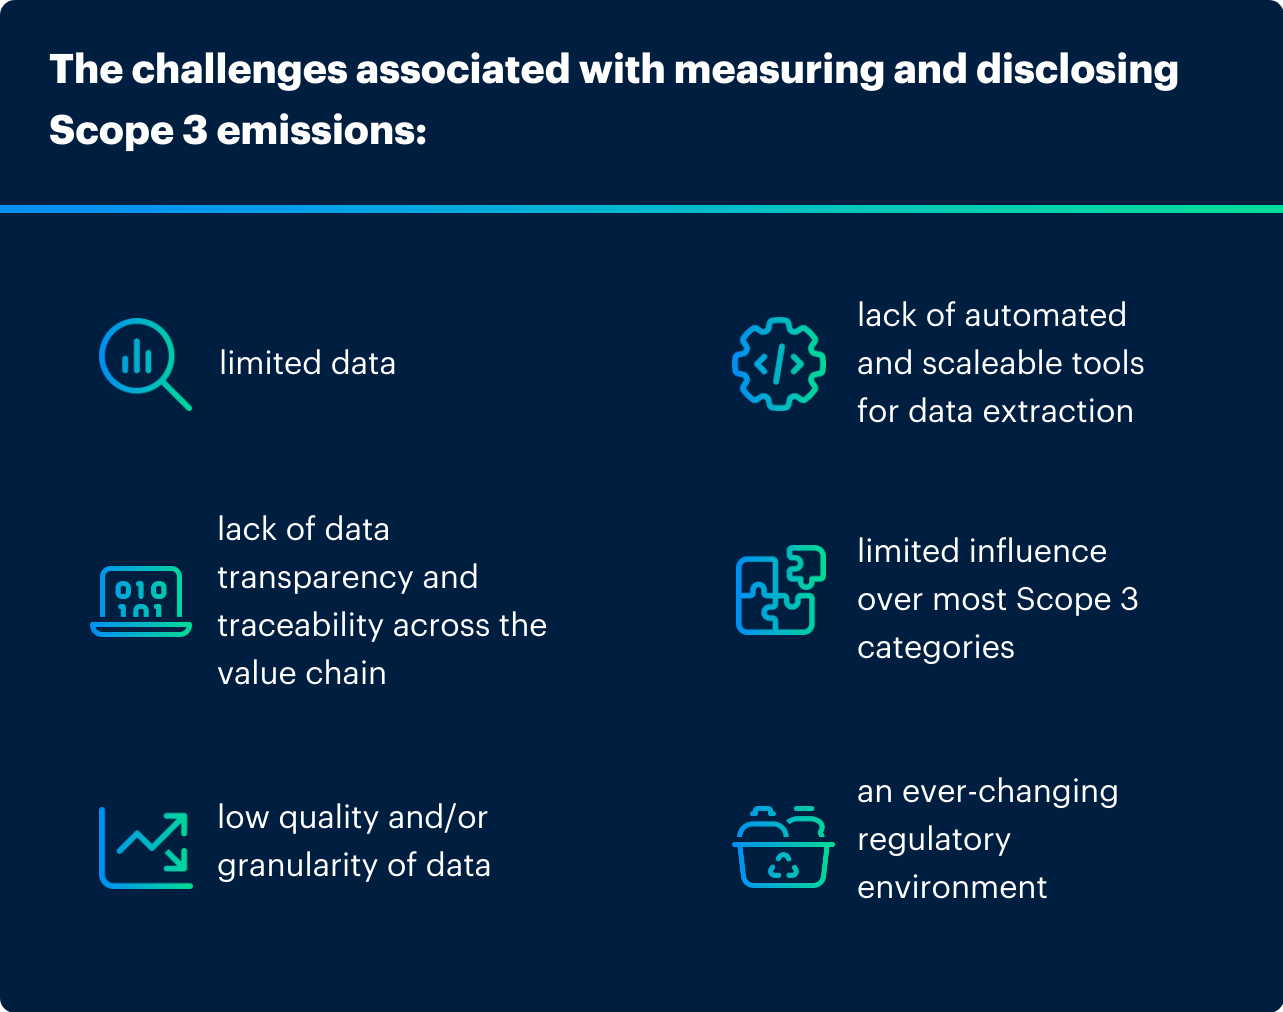
Only 41% of disclosing companies reported emissions for one or more Scope 3 categories in 2022, despite those emissions being on average 11.4 times higher than operational emissions. Over the same period, 71% of disclosing companies reported Scope 1 and/or 2 emissions. This disparity is due to the challenges associated with measuring and disclosing Scope 3 emissions: limited data; data transparency and traceability across the value chain; low quality and/or granularity of data; lack of automated and scaleable tools for data extraction; limited influence over most Scope 3 categories; an ever-changing regulatory environment.
Chemical producers need an end-to-end picture of supply chain emissions to be able to calculate their carbon footprint with accuracy. To do so requires a systematic methodology, but obtaining primary emissions data at supplier level is impractical; and, given the lack of a standardised method for calculating carbon emissions, this is both arduous to compile and most likely inaccurate. Many chemical producers consequently rely on generic, aggregated secondary data when setting targets and reporting. An average product’s carbon footprint by country conceals vast differences between individual producers.
Not all polypropylene is created equal
All polypropylene (PP) may look identical, but the carbon footprint of the finished product will differ significantly according to the method and feedstock employed in its production.
Chinese PP has an average carbon footprint of 4kg CO2 equivalent per kilo of PP (compared with, say, 1kg for South American PP). But China is home to some of the world’s most, and least emissions-intensive PP producers. There are, in fact, very few Chinese producers with an actual carbon footprint of 4kg CO2 equivalent per kilo of PP. The highest emitting PP producer has a carbon footprint 11 times that of the lowest.
For instance, Manufacturer A’s method of gas-phase polymerisation using crude oil and gas oil as feedstock, and steam-cracked naphtha will produce PP with an extremely low carbon footprint. Whereas manufacturer B’s suspension method, using coal and gasification as feedstock, and methanol-derived propylene will produce PP with a significantly higher carbon footprint. In reality, there are hundreds of ways to produce PP, employing different processes and raw materials.
A polymer comprised of multiple chemicals presents a different set of challenges. Lego bricks, for example are made from ABS (Acrylonitrile Butadiene Styrene). Each of the three chemicals involved (acrylonitrile, butadiene and styrene) will likely be produced using different processes. The carbon footprint for the finished product will therefore need to factor in three individual carbon footprints.

Additionally, information on a producer’s feedstock and production method only tells half of the story. Three categories of data are required to compile an accurate picture:
- Market intelligence revealing the location of all the plants globally that produce a particular chemical; the type of technology they employ; their capacity and current output;
- Technical data on the patent used at each plant, to be able to assess the inputs/outputs and direct emissions from the production process;
- Trade data, to reveal the likely source of the raw material used, depending on territory/market.
How can digital infrastructure help achieve net zero goals?

Digital infrastructure seamlessly integrates data, technology and delivery mechanisms to enable the analysis of different strands of data in order to form a complete picture and support businesses on their path to low emissions. Supplier Carbon Footprints provides carbon emission data on 71 bulk chemicals and plastics used in the production of the vast majority of manufactured goods, down to plant and supplier level. Accessed via an easy-to-use interface, Supplier Carbon Footprints provides the visibility and granularity required to measure and manage Scope 3 emissions, set emission reduction targets, and benchmark production against competitors.
ICIS’ Recycling Supply Trackers for both chemical and mechanical recycling, are a searchable, filterable database of individual suppliers, showing production capacities, output volumes, feedstock source and current site status. They enable market participants to source recycled polymers and connect directly with suppliers.
With this level of granular detail, chemical producers can meet net zero targets:
Conclusion

The chemical industry needs to be able to meet net zero targets. In order to be held accountable, these targets must be transparent, realistic and measurable. This is only achievable with accurate, end-to-end market data.
The benefits of doing so range from enhanced brand reputation and increased customer loyalty in the short-term, to an improved ability to plan and invest strategically for the longer term to capitalise on customer demand for lower carbon-intensive products.
While the scale of the challenge might seem daunting, digital infrastructure and the opportunities it affords, already offer a solution.
Author:
Corinne de Berry is a Senior Copywriter at ICIS, working across sustainability, chemicals and energy. Her interests span decarbonisation/net zero, recycling and the energy transition.
Related Content
Speak with ICIS
If you are looking to learn how our market intelligence can help you better navigate complex commodity markets, get in touch with us today. Complete your details, submit the contact form and a member of the ICIS team will be in touch.