The question came over innocuously enough.
“Market prices for ethylene are structurally the highest in Europe and lowest in US with Asia moving in between. … For MEG, however, my understanding is that there is not such a high difference between market prices in US and EU. What is the reason for that? Main cost driver for MEG is in the end the cost of ethylene.”
The answer I gave to the answer the email contact: Because the cost driver is not always the price driver.
That runs counter to production economics, which dictate that costs incurred in obtaining upstream materials should dominate downstream product prices. If the plastic I use to make a pen costs me $1, then logically the pen I make from it has to be priced at north of a dollar – probably at $2, since I like to pay my people well.
But what if half of the domestic pen market buys their pens from overseas producers who get plastic for just 50 cents, which allows them to sell their pens in my market for $1.25? I had better sell mine for around $1.25 if I want to compete.
That pen market is an analogue for the Europe monoethylene glycol (MEG) market, where pricing is not tied to feedstock ethylene because of substantial imports of the product from two regions – the Middle East and the US.
The ICIS Supply & Demand Database (a great product to understand current and future market dynamics) illustrates the supply/demand/consumption picture for Europe quite clearly:

Notice the circles. Almost 44% of Europe’s MEG consumption need in 2019 had to be met from imports, and it happens that the two regions exporting to Europe are the two most cost-advantaged at making ethylene – the Middle East and the US. See the trade flow chart below from the ICIS Supply & Demand Database, showing Europe’s net importer status (red bar) and the net exporter statuses of the Middle East and North America (blue bars).
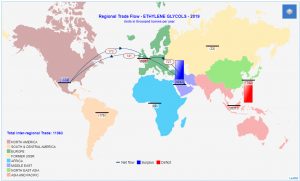
With that much imported product coming in being made from cheap feedstock, that means pricing for European MEG is going to correlate more with MEG and ethylene price movements from those exporting regions than it is with product made from European ethylene.
Put another way, European MEG producers have to base their pricing strategies on MEG import prices way more than their own feedstock costs.
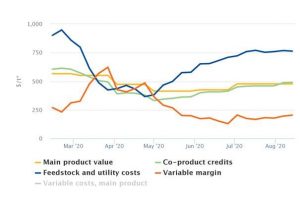
At least all the naphtha cracking in Europe means there are plenty of other co-products for integrated producers to make up for selling MEG so cheaply. The following margins graphic from ICIS Analytics shows an almost $500/tonne in co-product credits right now – that’s more than the MEG contract price itself!
Linear logic does not always dictate how chemical markets move, so it’s important to have access to tools that can decipher the mystery – tools such as ICIS Supply & Demand Database, ICIS News and ICIS Analytics. They answer innocuous questions with trusted insight.
Disclaimer: The views in this blogpost should in no shape or form be taken as actual forecasts and are my personal views only.