
CHINA’S NET IMPORTS of HDPE could be either 126m tonnes in 2023-2040, 38m tonnes or as low as 7m tonnes
Asian Chemical Connections

China’s LLDPE and LDPE markets see overstocking on unfounded recovery hopes
China’s LLDPE imports in February this year reached their highest level for that month on record – 499,168 tonnes.
This seems likely to have been overstocking on anticipation of the post zero-COVID bounce back that hasn’t happened, as imports in March April fell month-on-month by 6% and 7% respectively. January-April 2023 exports also reached 64,678 tonnes – 96% higher than last year.

India, climate change, demographics and polymers demand growth
Climate change and demographics are economic destiny – their effects cannot be avoided. But the petrochemicals industry has a huge role to play in shaping favourable outcomes

China PE demand growth in 2023 could be only 1% versus forecasts of 5%
Early data suggest China PE demand growth in 2023 will follow the trend since 2021 of much, much lower growth.

US PE exports in 2023 are not inevitably going to increase
A SCENARIO-BASED approach is essential to understand US PE exports in 2023, based on non-plant economic factors

SEA Asia PE market dragged lower by China now container freight rates have fallen.
The decline in container freight rates has opened the SEA PE market to more competition – pulling the region’s spreads closer to the record-low China levels
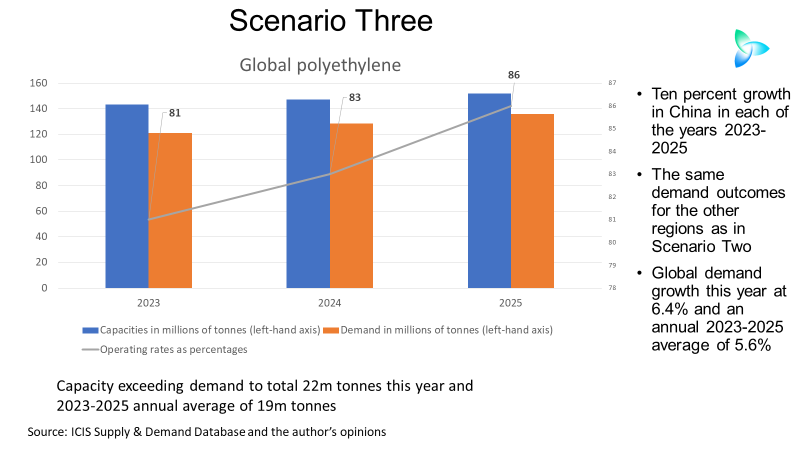
Collective wishful thinking could be behind the global polyethylene crisis
EVEN IF CHINA’S PE demand grows at 10% in 2023, with very strong growth in other regions, this year’s global capacity would still be 22m tonnes more than demand!

Global PE new supply and China spreads tell the real story
Global PE capacity in excess of demand is forecast to average 24m tonnes/year in 2022-2025, and to reach 26m tonnes this year
Operating rates are expected to average 81% in 2022-2025. This would compare with a 10m tonnes annual average capacityexceeding demand in 2000-2021 and an operating rate of 85%.

Your complete and updated outlook for global polyethylene in 2023
The strength of China’s post zero-COVID recovery in 2023 will be crucial, as will local operating rates as self-sufficiency further increases.
Another important factor: European gas supply next winter and the effect on local PE production.

China HDPE 2023 demand and net import forecasts
Scenario 1 for next year assumes that China successfully transitions from its zero-COVID policies. Consumer confidence comes roaring back. Demand grows by 4% year-on-year to a market of 17.6m tonnes.
Scenario 2 assumes that high infection rates and lack of healthcare resources keep consumer confidence depressed but that the global economy recovers, supporting China’s exports. Growth is minus 2%, leaving demand at 6.6m tonnes.
The worst-case outcome is Scenario 3 where the impact of zero-COVID continues, and the global economy gets weaker. Consumption falls by 4% to 16.1m tonnes.
Jump to page: