IN A WORLD where margins per tonne of production entirely shaped human behaviour – and one where demand wasn’t the problem – the above chart might convince some people that the US polyethylene (PE) industry is heading for a strong year of export-based earnings in 2023.
And when you add the context of easing US logistics constraints (more availability of railcars and trucks) and local PE capacity additions, it is possible to reach the conclusion that both US export volumes and earnings are about to surge.
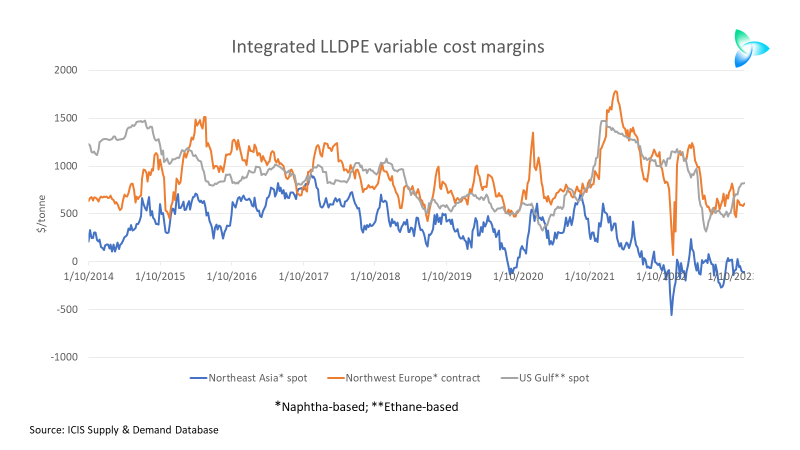
Before I challenge this assumption in the interests of scenario planning, let me give some details behind the above chart. The chart shows the ICIS variable cost margins for one of the three grades of PE – linear low-density (LLDPE).
The pattern is similar in high-density PE (HDPE). Northeast Asia (NE Asia), including China, is also suffering negative margins in this grade, whereas the US Gulf and Northwest Europe (NWE) are enjoying strong positive performances.
In the much tighter low-density PE (LDPE) market, all three regions are making money, but NE Asia is again the worst-performing region.
Note that I’ve chosen spot margins for the US Gulf as these reflect its export position. NE Asia is solely a spot market. In NWE, I’ve picked contract margins, which are slightly higher than spot margins, as the contract market accounts for the vast majority of European PE sales.
Human behaviour isn’t always entirely driven by plant-based economics
Anyway, back to the first paragraph in this post – if there is one thing I’ve learnt in 26 years of following the polyolefins business, it is that human behaviour isn’t always driven by plant-specific economics.
My first experience of the need to look at the broader picture was in 1997-1998, during the Asian Financial Crisis, when I was told that South Korean crackers and PE plants would permanently shut down because they were losing money.
But the plants continued to run on financial support from the big conglomerates of which they were a part. The South Korean government also supported the industry through brokering a series of “Big Deal” restructuring initiatives that left the industry in a healthy condition.
The South Korean petrochemicals business then came roaring back after 1998, thanks to the China demand boom.
Wind forward to today. Despite the above chart, I believe this teaches us that it is unwise to assume that we will see the closure of South Korean complexes in 2023, making more room for US PE exports.
Sure, operating rates in NE Asia have been cut since the fourth quarter of last year because of the weak market conditions. But decisions to close down altogether are further complicated by the wide range of petrochemicals made in many complexes and links to upstream refineries.
In China, the local PE industry has always received strong government support through competitive financing and tax breaks.
And as China’s PE industry is strategic for the government – because it is helping China escape its middle-income trap while raising supply security for geopolitical reasons – I don’t think we will see capacity closures.
In fact, the reverse is likely to happen as a lot more capacity comes onstream in China in 2023.
You might argue that the US isn’t heavily, directly exposed to exports to China – which is true.
In HDPE for instance, 35% of total US exports went to Canada and Mexico in 2022. The US, Canada and Mexico are members of the North American Free Trade Agreement (NAFTA). South and Central America accounted for 26% of US HDPE exports in 2022, with Europe at 12% and China the next biggest region at 8%.
But I like to think of the global PE market as a bucket half-filled with water being rocked backwards and forwards. This means that the water flows to different parts of the bucket at different times.
From March 2021 until Q4 2022, the bucket hardly rocked at all because high container freight prices and a lack of container space meant that PE couldn’t easily flow between regions. This left oversupply in NE Asia largely trapped in the region.
Not now, because freight rates have collapsed. Global trade has returned to normal. China’s weak demand growth and rising self-sufficiency is depressing pricing elsewhere.
In other words, even though US PE producers are not heavily exposed to exports to China, my metaphorical rocking bucket is still a significant threat.
Back to the theme of non-plant economics that can drive production decisions.
There are two major new PE complexes due onstream in southeast Asia (SE Asia) in 2023. Both have partly been built to generate local wealth and jobs, and to take advantage of good long-term growth prospects in SE Asia.
Again, therefore, even if these plants don’t have as strong margin positions as US plants, we should not expect them to necessarily operate at low rates during the rest of this year.
We next need to think about global PE demand during the rest of 2023

The above chart, from the excellent ICIS Supply & Demand Database, tells us this:
- Global PE capacity exceeding demand is forecast to average 24m tonnes/year in 2022-2025, and to reach 26m tonnes this year with the average 2022-2025 operating rate at 81%.
- This would compare with 10m tonnes annual average capacity more than demand in 2000-2021 and an operating rate of 85%.
I went into the reasons why we are in this historically bad position across all petrochemicals in a post earlier this month. Suffice to say here, it is because historical demand has been overestimated.
As for future demand, conventional thinking is now behind my long-held view that China will see a muted economic recovery in 2023. I see this as being because of demographics and debt.
Emerging threats to consumption growth include the “lag effect” of previous interest rate rises. Even if the rate of interest rate rises is slowing down in the West, history teaches us that it takes several quarters before earlier rate rises start to affect economic growth.
In the developing world ex-China, demand could be weakened by the strength of the US dollar (tied to the level of US interest rates) and the effect that the US dollar has on the region’s currencies, along with the costs of servicing sovereign debt.
Scenarios for US PE exports in 2023
As the above comments hopefully demonstrate, we live in a world a great deal more complex than is suggested by a quick glance at the ICIS margins chart. We therefore need scenarios for US PE exports in 2023, starting with the chart below for HDPE.
Each of these charts use the approach of taking the last three years’ percentages of exports over capacities to forecast what might happen in 2023.
It is, of course, perfectly possible that exports as a percentage of capacity in 2023 exceed or go below the historical figures for the last three years. But this is at least a starting point for evaluating what might happen next.
Here is the HDPE chart.

Here is the LDPE chart.

And here is the chart for LLDPE.

Here are all are the percentage of US exports over capacity for each of the grades from 2000 until 2022. This illustrates the growing US reliance on exports following big capacity expansions.

The above analysis obviously misses what could happen in the US domestic market. For a deep understanding of PE demand and supply in the US, I highly recommend that you speak to my ICIS colleagues at our US office.