
By John Richardson
THE ABOVE CHART underlines what I have been warning about since late last year: The chances of a strong recovery in China’s polyethylene (PE) demand growth in 2023 are very slim indeed.
If you annualise the January-February China Customs department data on net imports and combine this with our estimates of January-February local production (divide the total number by two and multiply by 12), you end up with average 2023 demand growth across the three grades of just 1%.
Growth of 1% this year would compare with zero growth in 2022 and minus 1% growth in 2021. Back in 2019, during an entirely different economic era, demand growth was 10%.
The notion of a strong demand rebound is based on a big pick-up in economic activity following the end of the zero-COVID lockdowns.
But as I keep stressing, think of the Chinese economy as an automobile which used to travel at 110 kilometres-an-hour (km/h).
During Zero-COVID, the car slowed down to 30KMH and will likely eventually return to a speed of 70/kmh as economic activity further picks up now that zero-COVID is over.
However, the vehicle can never return to 110/kmh because:
- The housing bubble has burst for good, ending the old “put option” that the government would never let property and land prices fall. So, confidence to invest in real estate seems unlikely to return to the heady levels of 2009-2021.
- Concerns over further sudden changes on government policy might damage consumer and investor sentiment following the sudden end to zero-COVID.
- Year-by-year, the impact of China’s shockingly bad demographics is getting worse. Savings rates to meet rising pension and healthcare costs seem likely to increase because of the ageing population. This also circles back to real estate, as real estate is no longer a strong as a source of wealth creation to meet pension and healthcare costs.
- The 10% PE demand growth in 2020 was to some extent the result of China’s booming exports of manufactured goods that met demand for exercise machines, computers and office furniture etc from cash-rich, bored lockdowners in the West. These exports came wrapped in PE or were partly made from PE. As the pandemic ended, there was always going to be a cycle out of spending on physical goods and into services that would weaken China’s exports. This decline has been made worse by inflation. China’s export earnings have fallen during the last five consecutive months.
What the March PMI data tells us
Some good news is that the official non-manufacturing Purchasing Managers’ Index (PMI) soared to 58.2 in March from 56.3 in February, its best level 2011. The index measures business activity in the services and construction industries.
But based on my entirely unscientific discussions with friends and contacts in China – along with the arguments I’ve detailed above – I believe that we have already seen most of the rebound in consumer spending.
Julian Evans-Pritchard, who was quoted in this 31 March Financial Times article, appears to concur.
“Much of the immediate boost from dismantling virus restrictions has already passed,” with the economic recovery “likely to moderate over the coming months”, said Prichard, who is head of China Economics at Capital Economics.
Then there is the problem with exports that I highlighted above.
“China’s sprawling manufacturing sector, accounting for a third of the world’s second-largest economy by value, lost momentum in March amid still-weak export orders, tapping the brakes on the country’s economic recovery from restrictive COVID-19 policies,” wrote Reuters in this 3 April article.
Reuters was referring to the Caixin/S&P Global China manufacturing PMI which fell to 50.0 in March. This followed February’s reading of 51.6, which was the first expansion in seven months.
The PE demand data in detail
Now let us examine the above chart in detail, with the proviso that just two months of net import and local production data can only give us a preliminary steer about what might happen during the full year 2023.
In high-density PE (HDPE), the net import plus local production data suggest a 3% decline in annual 2023 demand.
This would follow zero growth last year and minus 4% growth in 2021. Consensus views on China’s HDPE growth in 2023 assume 5-6% increases.
China’s HDPE net imports on a year-on-year basis in January-February fell by 15% as local production increased by 6%. China’s capacity is forecast by ICIS to increase by 12% in 2023 following a 22% increase last year.
In low-density PE (LDPE), the January-February numbers indicate a 0.4% fall in demand growth in 2023. This would represent a fourth year in a row of negative growth, albeit much lower negative growth than last year’s contraction of 3%.
Year-on-year LDPE production crept higher as net imports declined by 9%. Local capacity is forecast to increase by 3% in 2023.
The consensus is for a 3% increase in China’s LDPE demand in 2023.
Linear-low density PE (LLDPE) is entirely different, however. The January-February data suggest 6% demand growth in 2023 demand following a 1% increase in last year. Growth of 6% fits with consensus thinking.
Year-on-year LLDPE net imports were up by 14% with local production just about flat. The increase in in net imports occurred despite a forecast 5% increase in local capacity in 2023 following an 11% increase last year.
There may have been overstocking in LLDPE. This could have been in response to the widespread and to date unfounded view of a big surge in economic growth following the end of this year’s Lunar New Year Holidays.
Let me stress, though, that I think the proverbial automobile will still likely pick up some speed before the year is out. I am therefore sticking to my earlier forecast that China’s PE demand growth will reach an average of 3% across the three grades in 2023.
A new outlook for PE net imports in 2023
Again, please don’t say I didn’t warn you. I’ve been flagging up the risk of much greater China petrochemicals self-sufficiency in general since 2014 following an important pivot in government policy.
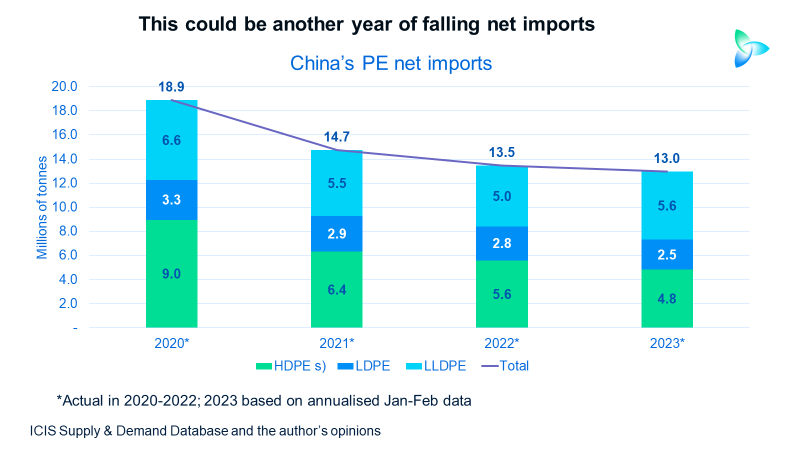
The above chart – based on annualising the January-February net import numbers from the China Customs department – show that total PE imports could fall to 13m tonnes this year from their all-time peak of 18.9m tonnes in 2020.
The biggest decline could be in HDPE. This year’s net imports might be at just 4.8m tonnes versus 5.6m tonnes in 2022.
LDPE net imports may also slip to 2.5m tonnes in 2023 from 2.8m tonnes in 2022.
But the January-February statistics indicate that LLDPE net imports could rise to 5.6m tonnes in 2023 from last year’s 5m tonnes.
Conclusion: “It’s the spreads, stupid”
As Wikipedia writes: ‘“The economy, stupid” is a phrase that was coined by James Carville in 1992. Carville was a strategist in Bill Clinton’s successful 1992 presidential campaign. The phrase was directed at the campaign’s workers and intended as one of the messages for them to focus on.”
The same applies to how we avoid all the distracting noise over the strength of China’s post-COVID recovery.
Until or unless the China average PE price spread over naphtha feedstock costs recovers to much closer to its long-term average, all the talk of a recovery can only possibly be talk.

The long-term annual average spread – between 1993 and 2021 – was $525/tonne.
The latest iteration of my regular chart shows that the average PE spread in January-March this year was just $291/tonne, breaking previous record annual low of $321/tonne in 2022.