By John Richardson
WHAT FOLLOWS is a summary of the key global challenges facing the polyethylene (PE) industry in 2023 (many of these challenges apply to petrochemicals as a whole). I have made use of previous blog posts, which I have linked to below, and some new insights.
Let’s start with a summary slide before we go into the details. This slide is the result of calls I’ve made to contacts since late last year, so it represents a reasonable “wisdom of crowds” about what we confront.

China and its ambiguous recovery
Nobody has a clue about the strength of China’s recovery in 2023, as I discussed in my 26 January blog post, because we are dealing with an intangible that defies data analysis: the strength of consumer and investor confidence.
Because China is a managed economy there must be a high level of confidence in many aspects of how the economy is being managed.
For as long as most of us can remember, confidence in government economic management has been high. But to what extent has this been undermined by the bursting of the property bubble and the handling of the exit from the zero-COVID policies?
There is lots of talk about “revenge spending” as large portions of the economy re-open, which were entirely shut down during the era of zero-COVID
We have some hard numbers on the amount of excess savings built up since zero-COVID began – $2.6tr of additional bank deposits, according to a 24 January Financial Times (FT) article.
The FT, however, quoted analysts who said that when you discounted money transferred into banks from high-risk financial products, mainly in real estate, and the “natural growth” in savings due to higher incomes, this left just $200bn of potential revenge spending.
How good will China’s exports be in 2023? Has inflation peaked in the West, or might a strong China recovery reignite global inflation and dampen exports worth 20% of China’s GDP?
As I again discussed in my 26 January post, these uncertainties make it necessary to draw up a wider range of China petrochemicals demand growth scenarios than usual. In polyethylene (PE), I presented four, rather than the usual three, scenarios ranging from a best-case outcome of an average 4% growth across the three grades to a worst case of minus 5%.
As the next slide shows, China’s growth will play a major role in shaping global excess PE supply and operating rates in 2023. This is because China accounted for 33% of global demand in 2022, up from just 12% in 2000. China has become by far the world’s biggest consumption region.
Global PE capacity in excess of demand at 26-29m tonnes in 2023

The ICIS base for China’s PE demand growth in 2023 – 4% growth, which I see as the best-case outcome – would still see global capacity in excess of demand at 26m tonnes, up from an annual average in 2000-2022 of 10m tonnes.
Under this base case, global operating rates would slip to 79% from the 2000-2022 average of 86%.
In my worst-case outcome for China growth in 2023, which I don’t see as likely, the global operating rate would slip to 77% with surplus capacity over demand rising to 29m tonnes. China’s PE consumption would be 3,5m tonnes lower than our base case.
Some scale of economic recovery should happen in China this year after a disappointing 2022. My preferred scenario is an average 2% growth across the three grades.
But the downside in the above chart underlines the need for devoting more resources to understanding China. A lot of these resources should go into “gut feel” and on-the-ground experts because of the increasing difficulties in getting reliable data out of China.
What we cannot do is to stick to the “one size fits all” view of some analysts that everything will be fine once the Lunar New Year is over. There is no firm evidence pointing to the inevitability of such an outcome.
Beyond a tipping point for China’s net PE imports
The next chart illustrates how we have gone beyond a tipping point in China. Only two years ago, quite minor changes in operating rates and demand-growth forecasts made little difference to net import projections. Not now, because of the rapid build-up in local capacities.
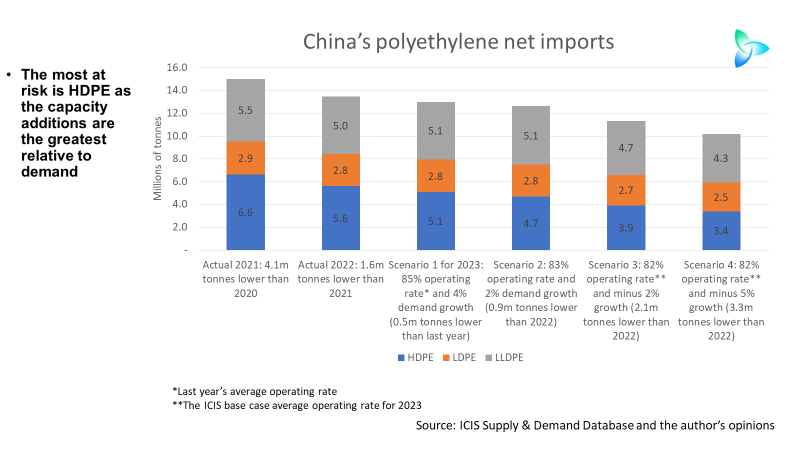
Because local high-density (HDPE) capacity is forecast to reach 87% of domestic demand in 2023, compared with 79% for linear low-density (LLDPE) and 59% for low-density (LDPE), the range of this year’s potential HDPE net imports is the widest.
Last year’s HDPE net imports were 5.6m tonnes. In 2023, they could be as high as 5.1m tonnes or as low as 3.4m tonnes.
Next winter could see more Europe PE capacity shutdowns
When Russia first invaded Ukraine, a major question in global PE markets was whether gas supply-enforced capacity shutdowns would result in more demand for European PE imports.
The data for 2022 doesn’t point to a big increase in imports relative to local demand.
This is because while some PE plants have been shut down for gas cost reasons, we entered the winter months with gas storage at high levels in Europe. Pipeline gas supplies from Russia were not reduced until last summer, and high European inflation resulted in lower-than-expected demand.
Still, though, as you can see from the ICIS chart below, European shutdowns across all petrochemicals and fertilizers have been substantial because of the gas cost issue. As of 20 January, 26m tonnes/year of capacity was offline.

But more shutdowns of PE plants may occur next winter as Russian pipeline gas supplies have now been turned down. The EU is warning that gas consumption will have to be further reduced to avoid shortages. A lot will, of course, hinge on how cold the weather is.
The ICIS energy and petrochemical teams will keep you up to date on any further PE shutdowns during the 2023-2024 winter.
Timing of permanent PE shutdowns likely to hinge on upstream refineries
The quite staggering global PE chart above points towards the need for temporary and very probably permanent capacity shutdowns.
Tracking temporary shutdowns is relatively easy as this is the bread and butter of our ICIS News and ICIS Pricing teams.
More difficult is forecasting permanent closures because of upstream refinery operations. PE plants may have to be kept running in order to enable refineries to maintain operations, as local diesel and gasoline supplies are essential – especially in inland markets where importing fuels is expensive.
The pace of refinery closures, and therefore downstream cracker and PE closures, is likely to be largely shaped by the pace of electrification of transport, especially in Europe. As more and more vehicles become electric, demand for diesel and gasoline will continue to decline.
Returning to the European gas issue, the chart below is a reminder of how exposed Europe is to higher energy costs.
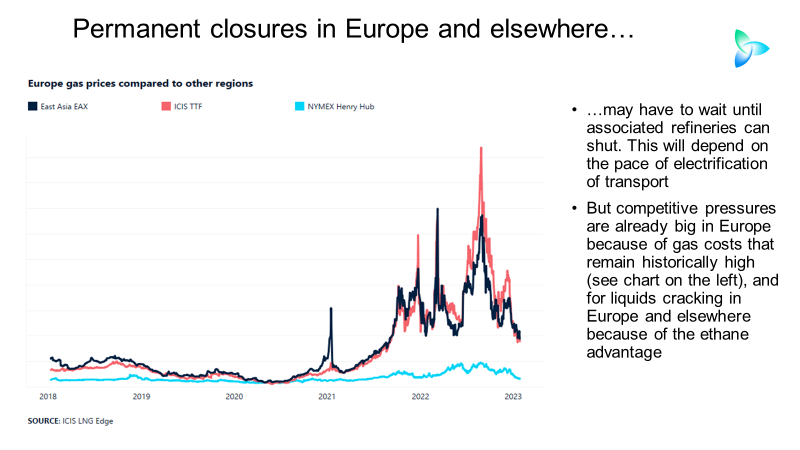
Big new PE capacity wave to exert more market pressure
“Despite falling from record peaks, costs for natural gas – a key element in utility costs and also a feedstock for some processes – are far higher than in other regions while Europe’s reliance on naphtha as a raw material pushes companies further up the cost curve compared with those which use ethane in the US and Middle East,” wrote my ICIS colleague, Will Beacham, in this excellent ICIS Insight article.
“The war in Ukraine pushed these structural disadvantages to new levels with gas prices spiking to historic highs. Although prices have now fallen to pre-war levels, they remain far above long-term levels. They also remain far higher than other important competing regions such as the Middle East and US,” continued Will.
“Europe has now lost access – most probably permanently – to cheap Russian oil and gas. Petrochemical producers, especially in Germany, had benefited from gas prices which were well below the going rate on global markets. Now they are exposed to global prices,” he added.
The PE industry everywhere is also under pressure from the collapse of container freight rates, as I warned would happen in an April 2022 post.
Lower freight rates have enabled the exporters to more easily divert oversupply from northeast Asia. This has led to falls in the PE price premiums for the rest of the world over China from record highs.
A big wave of new cracker-to-PE capacity is due on-stream over the next four years during a period of weak demand, as I discussed in my 23 January post.
The plants will be of a scale we’ve never seen before. One of the planned crackers would have an ethylene capacity of 2.1m tonnes. The economies of scale would therefore likely be world-beating, and several of the projects are based on low-cost ethane.
The new wave of capacity would put pressure on smaller liquids-based cracker-to-PE complexes everywhere. But, as I said, shutdown decisions are often complicated by the need to maintain upstream refinery operations.
The factors that will shape US PE exports in 2023
The biggest new capacity story is in China but running in close second place is the US. After major ethane-based PE capacity additions since 2015, another wave of US capacity is scheduled to come on-stream next year.
US HDPE capacity is scheduled to increase by 13% in 2023 to around 10.8m tonnes after a 1% increase in 2022, according to the ICIS Supply & Demand Database. LLDPE capacity is due to rise by 8% in 2023 after last year’s 13% increase. There are no capacity additions in LDPE and none took place last year.
The chart below provides an estimate for US PE exports in 2023.

Note that exports fell in 2021 because the Texas Winter Storm in February of that year caused major PE capacity closures. Hurricanes later in the same year led to further production losses.
This raises the question of whether we will see more weather-related production losses in 2023 that will curtail the US’s ability to export PE. Producers need to export 40-50% of their output to get decent returns on investment.
In a world of seemingly increasing climate change-related weather events, monitoring and forecasting weather have become important tools for our industry.
US exports in 2022 increased over 2021 but were still below the ideal level for producers because of shortages of warehouses, rail cars and truck drivers. Stay in touch with the ICIS CDI team to find out the latest on US logistics constraints, some of which are hangovers from the pandemic.
And, of course, demand will also determine the strength of US exports.
As things stand today, I expect PE exports in 2023 to reach a total of 11.5m tonnes compared with around 10.8m tonnes in 2022.
Conclusion: Handling the downturn

I am afraid that the downcycle won’t bottom out until 2024 at the very earliest because of the extent of today’s oversupply.
I make no apology for repeating the above slide which has been in several earlier blog posts because it is so, so important.
Dealing with this downturn must involve:
- Micro-management of markets, illustrated by the left-hand side of the V in the above chart. This has always been the case during industry recessions.
- But this downturn is likely to last a lot longer than any other downturn since the 1970s. And we are living in a vastly more globalised petrochemicals world than in the 1970s.
- So, there will be many more troughs and dips – caused by fluctuating demand, supply and pricing between different countries and regions – than has been the case before.
- This creates a great opportunity to save vital cash flows by not allocating tonnes to markets that are weak, while allocating volumes to markets that are strong.
This can be achieved through an integrated and constantly updated view of all the global markets, using the ICIS data and analysis on pricing, demand and supply – both current and forecasted.
Contact me at john.richardson@icis.com for help.