
By John Richardson
NOW I AM GOING to show my age here. The year of 1990 was when I got married and the year that the great footballer John Barnes wrapped on New Order’s World in Motion, the song for the England Football team’s Italia ’90 World Cup campaign.
This is how far back our China CFR (cost & freight) high-density polyethylene (HDPE) injection grade price assessment goes. And as the chart above shows, the spreads or differentials between China CFR HDPE injection grade prices and CFR Japan naphtha costs are this year the lowest they have been since 1990.
In January-August 2022, the spread averaged just $200/tonne compared with the previous record low of $288/tonne in 2002. Last year, the spread was more than double the January-August 2022 level at $405/tonne.
Major production cuts have raised hopes among producers that HDPE pricing may recover over the next few months. It depends also, of course, on what happens to oil prices.
Whether or not pricing recovers is largely irrelevant. What instead matters are the strength of the spreads between feedstock costs and product prices (patterns are very similar in many of the other chemicals and polymers markets to what you can see in the above chart).
Sure, apparent demand typically recovers when polymer prices rise because converters buy ahead of their immediate needs to hedge against further price rises; in other words, they build stocks. The reverse happens when prices fall as converters destock, reducing apparent demand.
But in a fundamentally very weak market, such as the one today. there is always the risk of a rapid push-back from converters when their resin costs increase.
And as the spreads data so clearly tell us, we are seeing the weakest market conditions in at least 32 years, for three reasons:
- China is trying to build a new economic growth model that involves the deflation of a real-estate bubble which is the biggest in global economic history. As I shall discuss in a post next week, now that the bubble is deflating it cannot be re-inflated. Most of the extraordinary boom in Chinese chemicals demand since 2009 is the result of the real-estate bubble.
- China’s zero-COVID policies seem likely to add further downward momentum to the country’s economy during the rest of this year and perhaps in 2023 as well. The government appears to be unable to relax the policies because of the limited effectiveness of Chinese vaccines.
- China is becoming much more self-sufficient in another wave of chemicals and polymers, including HDPE, as big capacity additions take place elsewhere. The market is also struggling to absorb plants that have come on-stream over the last 12 months.
Now let’s look at the spreads data on a month-on-month basis.

Before you get too excited about the rebound in spreads from their all-time low of $98/tonne in March 2022, this is only the result of oil prices, and therefore naphtha costs, falling more than the declines in HDPE prices.
In every month since March, HDPE prices have slipped as naphtha prices have fallen. In August over July, for instance, CFR China injection HDPE prices slipped to $946/tonne from $1,001/tonne as CFR Japan naphtha costs fell to $692/tonne from $790/tonne. This is hardly an indication of renewed producer market muscle.
Now look at what the latest data tell us about China’s HDPE demand in 2022.

As Scenario 2 in the chart below indicates, when you add the January-July ICIS estimate of local production to the China Customs net import number, then annualise the result (divide by seven and multiply by 12), you end with minus 4% growth for the whole of this year. This compares with the 3% decline in growth suggested by the January-June numbers.
Production cutbacks don’t seem to be working
As usual, I’ve provided you with two other scenarios – Scenario 1, a best-case outcome of minus 2% growth and a worst-case Scenario 3 of minus 6%.
Let’s for argument’s sake assume that minus 4% is the right number for this year. This would be the second year in a row that Chinese demand had contracted by 4%. In every year from 1990 until 2020, growth was positive.
We can explain last year’s fall in growth as a response to the bubble year of 2020, when demand grew by 11%. This was the result of the “China in, China out” story – the surge in Chinese chemicals imports and demand to meet booming sales of Chinese finished goods, as bored lockdowners in the West bought lots of durable goods.
But how do we explain what seems likely to be negative growth in 2022? I believe it is down to the first of the three market shapers I’ve detailed above. As for the third shaper – rising Chinese self-sufficiency – consider the chart below.

The January-July China Customs net import data suggest that the 2022 full-year net imports will fall to 5.5m tonnes from 6.4m tonnes in 2021. This is the basis for Scenario 2. I have again provided two other scenarios. January-June net imports pointed to this year’s net imports declining to 5.6m tonnes.
The ICIS estimate of production in January-July indicates a full-year operating rate of 79%. This would set another record as this would be the lowest annual operating rate since 1990. The lowest rate so far since 1990 was 82% in 2015.
But despite this apparent producer discipline, the spreads data show the desired effect doesn’t seem to be happening. The market appears to still be heavily oversupplied.
Returning to the spreads data, the chart below is a reminder that this year’s squeezed spreads are not the result of the surge in oil prices and therefore naphtha costs. Study the chart and you will see that during other periods of big increases in oil prices, HDPE producers were much better at passing-on their extra costs to converters.

What applies to spreads also applies to margins – the correct measure of producer profitability.
The chart below shows weekly Northeast Asian (NEA) HDPE injection grade margins since the first week of January 2014, when our assessments began. Shown below are naphtha-based and liquefied petroleum gas (LPG)-based integrated variable cost margins.

Let’s next put these margins into the annual context.
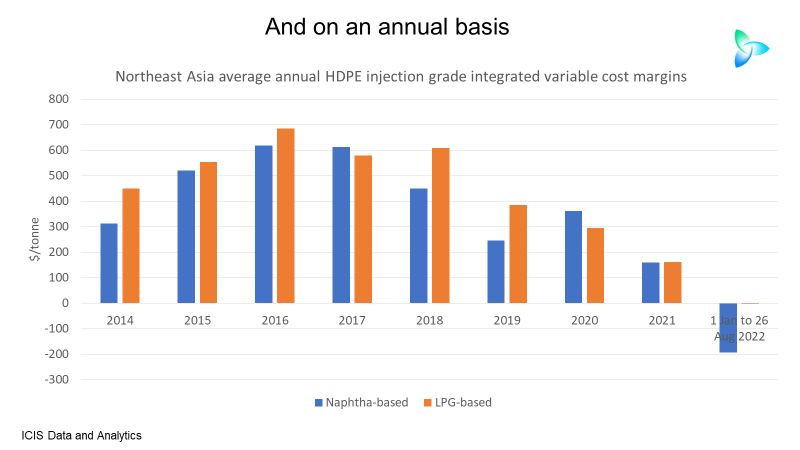
From 1 January until 26 August 2022, NEA naphtha-based margins averaged minus $192/tonne. LPG-based margin was exactly zero. This compares with average naphtha-based margins of $410/tonne in 2014-2021 and $465/tonne for LPG-based margins.
Conclusion: A recovery seems very unlikely this year
As I said, pricing might rebound over the next couple of months, but I doubt we will see a big improvement in spreads because we are facing a new China. Add this to the very difficult market conditions elsewhere and this is far from being a typical chemicals downturn.
This type of integrated data crunching, using the hugely valuable ICIS data, will remain so, so important for several more years as old business models are retired. They must be retired because the way forward is not the constant volume-growth we’ve all become hooked on. It is instead through providing services to customers as sustainability redefines our industry.