By John Richardson
THE DEBATE SEEMS TO BE OVER and so petrochemical companies need to move on. They need to move very quickly as I suspect that petrochemicals and polymers markets outside China will become more crowded because of the vast oversupply.
During discussions with senior executives at several major global petrochemical producers over the last week, I didn’t find anyone who doubted that China’s long-term petrochemicals demand growth would not be in the region of 1-2% per year, possibly even negative.
This is a remarkable turnaround from just six months ago when I felt that the consensus view was that once this year’s Lunar New Year holidays were over, China’s economy would come roaring back because of the end of zero-COVID.
But as I have been flagging up since September 2021, the tipping point has been reached. The demographic and debt pressures I’ve been warning about since 2011 mean, as I said, just 1-2% chemicals demand growth from now on with some years of negative growth.
This compares with the old consensus expectations of 6-7% per year. When you combine these overestimates with the failure to recognise that China was going to do what it said it would do in 2014 and push much harder towards petrochemicals self-sufficiency, the chart below makes sense.
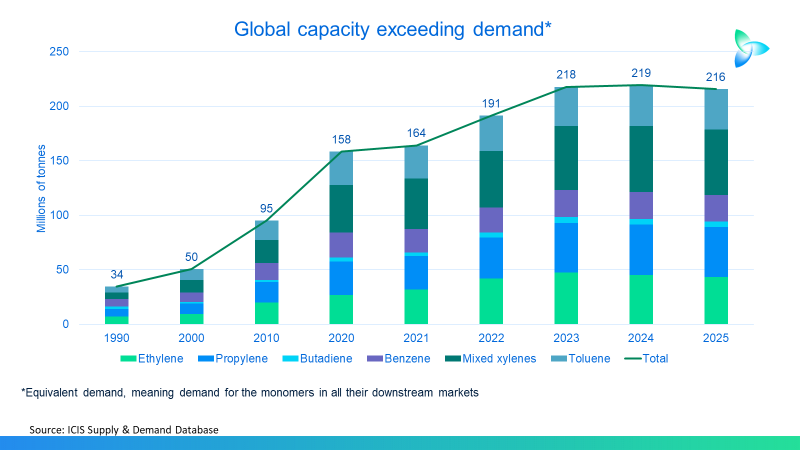
What you see here is rising oversupply from 1990 onwards in the six big petrochemical building blocks – ethylene, propylene, butadiene, benzene, mixed xylenes and toluene. This chart includes the consumption of the building blocks in all their downstream derivatives.
Note that I could have extended this chart beyond 2025 but didn’t see the value as any new projects beyond that year are at risk of cancellation. But projects up until 2025 are going to happen because final investment decisions have been taken, construction is already underway or they are about to come on-stream.
All downcycles come to an end. But for this one to end, permanent capacity closures might well need to happen because the short-term demand outlook cannot get significantly better. This is explained by the chart below.

Even if, for example, Africa’s polymers demand was to grow at 12% in 2023-2024 (highly unrealistic), this would not be enough to replace the growth in China that’s gone missing. This because of the scale of China’s share of global consumption.
Financial markets move on sentiment. Some participants in these markets are thus sticking to the argument that all that’s needed for China to return to normal is a big dose of new stimulus. They might not believe what they say, but that’s not the point.
But I’ve noticed a group of “new outliers” I’ve also spoken to recently who work for petrochemical companies. They are sticking to the notion that China’s demand will grow at much more than 1-2% per year.
For their benefit, consider this 26 June Bloomberg article, published in the Australian Financial Review.
“China’s consumer-driven recovery is showing more signs of losing momentum as spending slows on everything from holiday travel to cars and homes, adding to expectations for more stimulus to support the economy,” wrote Bloomberg.
“Domestic travel spending during the recent holiday for the dragon-boat festival was lower than pre-pandemic levels, according to official data released this weekend. Home sales figures are below the level in previous years, while estimates for June car sales showed a drop from a year ago,” the wire service added.
China’s consumer confidence will, I believe, remain subdued because of the collapse of the property bubble, rising pension and healthcare costs and high youth unemployment. I don’t see a return to the consumer exuberance of the last 20 years that led to all the misleading talk of “1.4bn middle-class Chinese spenders”.
The chart below shows year-on-year China polypropylene (PP) demand growth in millions of tonnes and as percentages since 2000.

The years from 2000 until 2022 are actual numbers, whereas 2023 is based on adding the January-May ICIS estimate of local production to the China Customs net import data and then dividing by five and multiplying by 12.
As you can see, consumption dipped into minus territory (a fall of 2%) in 2008 during the Global Financial Crisis. But then followed the economic bazooka of the world’s biggest-ever stimulus package in 2009. PP demand growth in that year was 15% as China added around 3m tonnes of new consumption.
This year, growth is heading for a 1% decline which would leave the market some 500,000 tonnes smaller than last year.
There is no chance of a new economic bazooka in 2024, leading to another year of double-digit PP growth because of:
- High levels of debt. “The zero-COVID shock and the housing crash last year seem to have brought China’s implicit government debt stress close to a breaking point,” wrote Wei Yao and Michelle Lam at SocGen in a report quoted in the 5 June edition of the Financial Times. China’s total debts are some 250% of GDP, more than the US.
- Even if Beijing found the wiggle room for another giant stimulus programme, it probably wouldn’t work as effectively as 2009 because of the loss of consumer confidence.
For the further benefit of those who are still adjusting to the New Normal, consider the next chart, showing the steep decline in China’s net imports since 2020.

China’s PP capacity as a percentage of demand first exceeded 100% in 2020 and could reach 124% this year.
Diversification into other markets

As the above chart reminds us, there are plenty of other big PP net import markets aside from China. These are estimate of 2023 PP net imports for countries and regions outside China compiled by ICIS at the beginning of the year.
The table below shows the percentage shares of total 2022 PP exports from two of the world’s major PP exporters that went to their top five destinations.
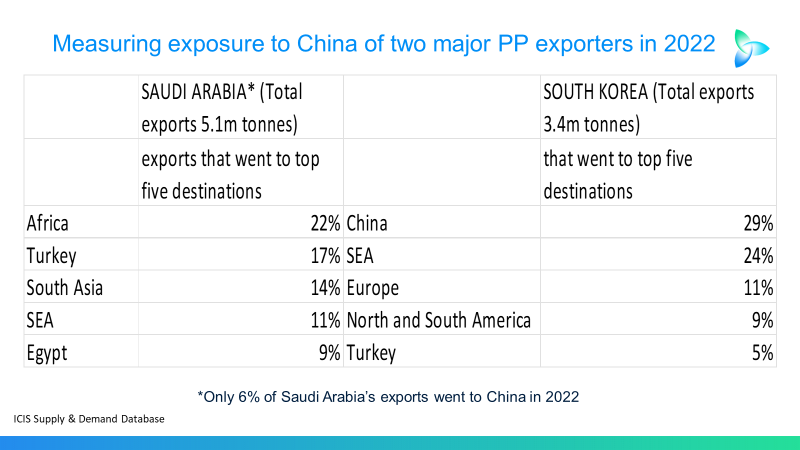
Saudi Arabia is extremely well hedged against weaker Chinese demand growth and the possibility that China could become a PP net exporter. As recently as 2021, China was the world’s biggest net importer.
Obviously, geography helps as Saudi Arabia is close to Africa. So does the country’s large fibre grade production which mainly goes to Turkey and Egypt to make carpets. Some of those carpets end up back in Saudi Arabia, with demand particularly strong after Ramadan as mosques are re-carpeted.
In South Korea’s case, geography has become a disadvantage because of its proximity to China versus its distance from Africa.
But in the case of the US, distance has been overcome by a free trade deal which allows US buyers to import South Korean PP duty free. South Korea also has a free trade deal with ASEAN, hence its strong trade with southeast Asia.
The South Korean government has long been active in securing bilateral trade deals that have supported the country’s petrochemicals and other industries.
Because of different currencies, import duties, payment terms, local business practices, and sometimes small cargo sizes, producers tend to rely on traders to sell to Africa and Latin America. But this means giving away value compared with direct sales.
As big PP exporters increasingly turn to markets outside China, the competition is going to intensify, especially given what today’s final slide tells us.
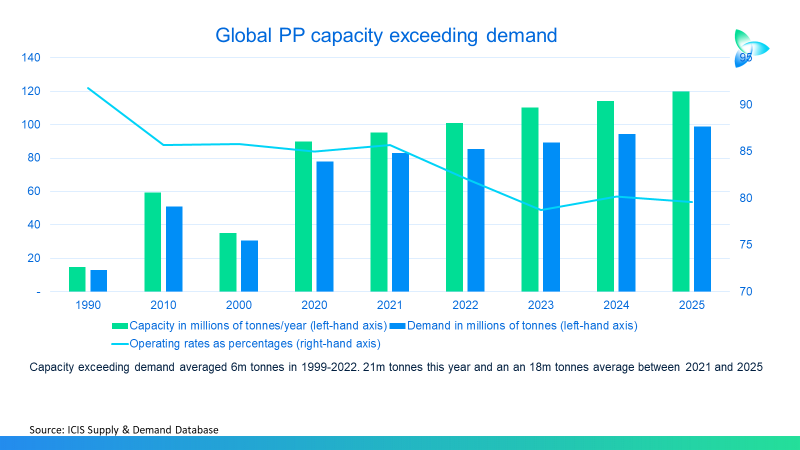
Global PP capacity exceeding demand is forecast to reach 21m tonnes this year compared with an annual average of 6m tonnes in 1990-2022.
Conclusion: Diversification requires more data and analysis
Sales diversification requires more data and analysis across a wider range of geographies – for example, access to more price benchmarks, along with increased data crunching between the benchmarks to calculate the best netbacks.
Everyone starts the year with a plan including global estimates of PP and other trade flows. But as the actual trade data emerges, estimates of trade flows need to be adapted along with sales tactics.
Future market direction will often hinge on sentiment, and the “look and feel” of events on the ground in, say, Turkey versus east Africa.
ICIS can help you with all the above. Contact me at john.richardson@icis.com.