By John Richardson
THIS IS A POLYPROYPENE ((PP) world being turned upside down. China has entered a period of lower growth with capacity additions so big that imports are collapsing as China also starts to substantially increase exports.
Let us firstly consider growth. I’ve been highlighting these two themes since March this year. Conventional thinking is now lining up behind me. There are now few people out there who doubt that:
- China is shifting away from “growth for growth’s sake”. As it attempts to build a new economic growth model (we don’t know if this will work), lots of collateral damage should be expected, most notably in the real-estate market, which, as the ICIS data show, has been a major driver of China’s extraordinarily strong chemicals demand growth since the property bubble began to inflate in 2009. In August this year, house prices in nearly 70 Chinese cities declined, according to Reuters.
- In the short- to medium-term, China’s zero-COVID policies will add further downward momentum to the economy. China cannot afford to scrap the policies because of the limited effectiveness of its vaccines.
The chart below – following on from the 25 August post on the latest outlook for Chinese PP demand in 2022 – provides the longer-term context for what seems likely to happen this year.
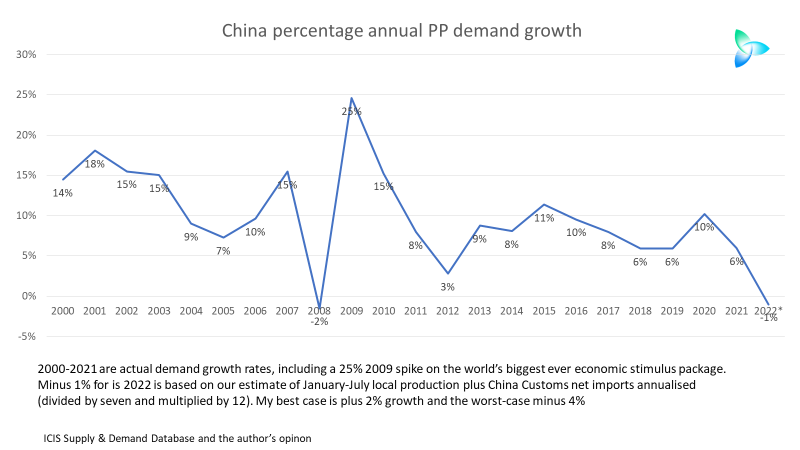
The 2000-2021 percentage growth rates are actual, including a 25% spike in 2009 from the world’s biggest ever economic stimulus package, most of which went into real estate. Now that the property bubble has burst with little chance of reinflation, we should expect a significant loss in growth momentum. There will be more on this theme in a later post.
Minus 1% growth in 2022 is based on our estimate of January-July local production plus China Customs net imports annualised (divided by seven and multiplied by 12). My best case is plus 2% growth for this year and the worst-case is minus 4%.
As you can see from the chart, minus 1% growth would be the second-worst decline since 2000 with the worst being the Global Financial Crisis year of 2008, when growth fell by 2%. But there is no chance of a stimulus-led rebound in 2023 – like the one we saw in 2009 – because of the Common Prosperity economic reforms.
A “perfect storm” for the global PP business
By itself, this year’s collapse in Chinese PP demand would be bad enough given the hugely increased role China plays in driving global PP demand. In 2000, the ICIS Supply & Demand Database shows that China accounted for 15% of global demand. Last year, this had risen to 41%, making China by far the biggest driver of global consumption.
But the problem is that the collapse in growth has occurred as China’s capacity continues to increase. In the 10 years from 2012 until 2021, China’s PP capacity increased by 145%. Capacity is scheduled to increase by a further 12% in 2022 over last year.
These expansions of capacity have occurred in parallel with the success of a government-driven mission to improve the cost-per-tonne economics of China’s PP industry (although as I shall discuss next Monday, standard cost-per-tonne economic analysis will not by itself help you understand China’s chemicals history and its future).
We can derive a headline measure of improving plant economics from the excellent ICIS Supply & Demand Database. In 2012, the average capacity of China’s PP plants was 122,000 tonnes/year, well below world-scale. Last year, this had increased to 191,000 tonnes/year.
As Beijing has tried to upgrade its manufacturing industry in an attempt to escape China’s middle-income trap, plants have also become better integrated, and have been increasingly located in state-of-the-art refining-to-chemicals complexes.
So, the global PP business industry faces a perfect storm of contracting Chinese demand and yet more capacity additions that have resulted in the chart below. This is an updated version of the chart I’ve been providing on the blog for the last three years.

Scenario 1 assumes a strong recovery in PP demand in August-December 2022 to leave annual growth at plus 2% with operating rates at 80%. But even in this best-case outcome, which I feel is unlikely, net imports at 3.5m tonnes would still be 2.6m tonnes lower than in 2020.
Scenario 2 is based on annualised data for January-July 2022. The ICIS estimate of an 80% operating rate for this year would be the lowest since 2000, reflecting the weak state of the Chinese market. This would lead to net imports of 2.4m tonnes compared with last year’s 3.4m tonnes.
Scenario 3 includes my worst-case outcome for demand at minus 4% and a big pick-up in production during August-December 2022 resulting in an annual operating rate of 84%, the same as is predicted in the ICIS Supply & Demand Database. China would swing into a net export position of 270,000 tonnes.
Consider the ramifications of even my best-case outcome for 2022 by studying the chart below.
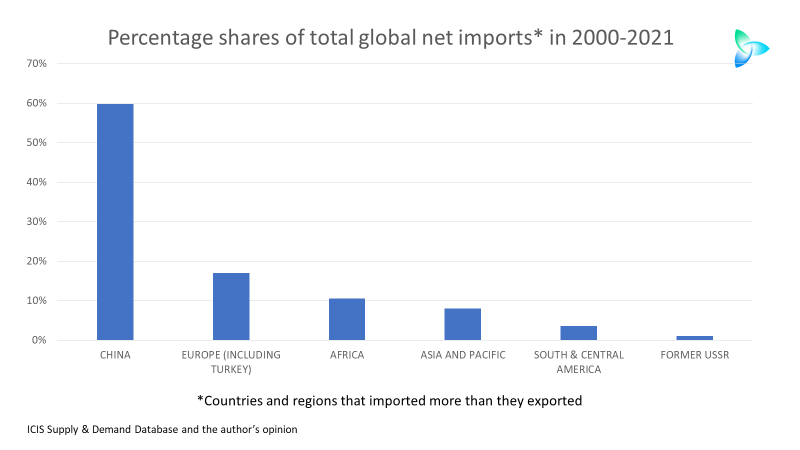
China was responsible for 60% of global net imports in 2000-2021 among the countries and regions that imported more than they exported. Europe, including Turkey, was in second place at 17%.
China becomes a major export player….
In 2020, China’s exports were just 424,746 tonnes. But in 2021, they rose to 1.4m tonnes, placing China among the leading global exporters.

The January-July China Customs export data, when again annualised, suggest that China’s exports in 2022 could reach 1.7m tonnes. China could therefore challenge Singapore as the third biggest exporter in 2022 among some of the major Middle East and Asian export players.
…as China spreads its export net much wider
Vietnam has long been China’s No 1 PP export destination because of the free-trade deal between the two countries. But look at what has happened since 2020.

Vietnam took a 34% share of China’s total PP exports in 2020, falling to 17% in 2021 and just 10% in January-July this year. China spread its net much wider in 2021 and in January-July 2022 compared with 2020. The top 10 export destinations in 2021 and 2022 have included India, Pakistan, Turkey and Brazil.
This is firstly because the Vietnamese market cannot absorb all the extra Chinese exports. Vietnam is also a highly competitive market because South Korea, too, has a free-trade deal with Vietnam. South Korea is one of the world’s biggest PP exporters.
The second reason is that much better PP netbacks have prevailed in India, Pakistan, Turkey and Brazil – and other top destinations in 2021 and 2022 – compared with Vietnam.
Since April last year, China has become very cheap versus the rest of the world due to its oversupply plus the high cost and lack of availability of container freight. This has made it difficult to move oversupply out of north and southeast Asia.
CFR (cost & freight) Vietnam PP injection grade price premiums over CFR China averaged $112/tonne between 1 January and 9 September this year, as the chart below shows.

Compare this with India and Pakistan. During the same period, Indian and Pakistan premiums averaged $216/tonne and $218/tonne respectively.

In Turkey, 1 January-9 September 2022 premiums averaged $325/tonne.

And finally let us look at Brazil, where premiums averaged an eye-wateringly high $600/tonne during the same period.

You don’t have to be Sherlock Holmes to work out a trend from all the above charts: All these countries’ price premiums over China have declined during 2022.
The China price deflation effect

Again, don’t say I didn’t warn you. The above chart confirms the accuracy of my forecast – first made in April last year, and which I’ve stuck to – that China’s depressed pricing would pull much of the rest of the world down to its levels rather than the other way around. As I discussed earlier this week, we are also seeing this happen in Europe PP and polyethylene (PE) prices versus China.
It is not going to get any better, in my view, as China continues to seek a relief valve for its PP oversupply, supported by improved plant economics and perhaps further yuan weakness versus the US dollar.
Integrated data analysis is essential
There is no point in sugaring the pill. These are exceptionally difficult times for the chemicals industry in general because of the big changes taking place in China and global inflation.
This makes the kind of integrated data approach highlighted above even more important than usual because these two decisions are so, so important in any downturn:
- Every tonne of PP and other chemicals and polymers you decide not to produce because there isn’t a viable market will save you vital revenues.
- Every tonne you do produce because the market works will earn you crucial money as a time of declining overall sales.
Volatility between regions will remain off the charts as we head towards the bottom of the PP and other markets. Saving or making money during the numerous mini troughs and peaks before markets bottom out will define your success or failure.