By John Richardson
IT HAS BEEN A fantastic three decades for the global petrochemicals industry thanks to three one-off historical events that were of course completely outside its control, as the polyethylene (PE) chart below reminds us. The chart is similar to the one detailing polypropylene (PP) that I published in March.

First came Deng Xiaoping’s “Southern Tour in 1992”, after which economic reforms were introduced that enabled China to begin to cash-in on what was then a very youthful population.
Then the dividends from its youthful population were fully maximised, thanks to China’s admission to the World Trade Organisation (WTO) in late 2001. This enabled China to become the workshop of the world because the tariffs and quotas that had restricted its exports to the West were removed.
But by as early as 2009, the demographic writing was the on the wall as the chart below confirms. By that year, births per woman had fallen to 1.7, well below the population replacement rate of 2.1. Births per woman have declined from 1969 onwards.

But the growing demographic challenges were masked by the launch of the world’s biggest-ever economic stimulus package in 2009. This, in effect, brought forward demand from future years, while also masking China’s gradually eroding demographic prospects through a huge increase in debt.
Let us return to the first chart and analyse what it is telling us:
- In 1990, per capita PE consumption in the developing world ex-China was around 2 kilograms (kgs) compared with 1kg in China.
- But by the end of last year, the picture had changed dramatically. China’s per capita PE consumption had reached 26kgs versus 8kgs in the rest of the developing world.
- Translated into millions of tonnes and measured against populations, the rest of the developing world consumed 39.7m tonnes of PE in 2022 from a population of 5.26bn; China consumed 38.3m tonnes from a population of just 1.45bn.
Now let us imagine an alternative history. What would the world of PE have looked like in millions of tonnes from 1990 until 2022 if the growth in China’s per capita consumption had exactly matched that of the developing world?
China’s cumulative PE demand would have been a staggering 237m tonnes lower in 1990-2022.
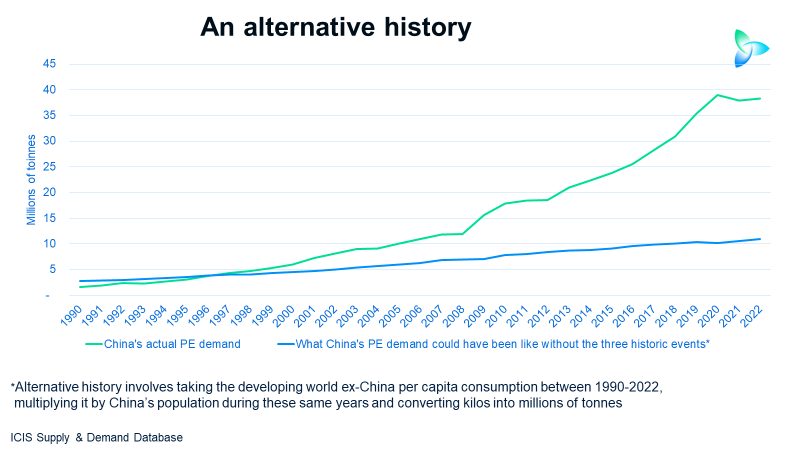
Now let’s imagine what would have happened globally in 1990-2022 if China’s PE demand had grown in line with the other developing countries.
This chart clearly shows how China’s admission to the WTO and the big economic stimulus package hugely supported global growth from the turn of the century onwards. Note the widening gap between the two trend lines.

If China had behaved like the rest of the developing world, the global PE market would have been slightly larger in 1990 at 31m tonnes rather than the actual 30m tonnes
But global PE consumption would have risen to only 87m tonnes in 2022 if China had grown like the rest of the developing world; instead, global demand was 114m tonnes.
Not enough discussion of demographics and debt
As China’s PE and other petrochemicals growth boomed during the past 30 years, there was very little discussion by producers of the developing demographic crisis and the debt challenges. Strong growth was instead attributed to China’s booming middle class.
But consider the rather complex chart below. The lines (left-hand axis) show PE per capita consumption in kilograms in the developed world versus China in 1990-2022; the right-hand axis shows per capita incomes in US dollars, this time in bars, between the same years.

The chart tells us that in 1990, China’s per capita PE consumption was 1kg, as mentioned earlier. In the developed world, per capita consumption was 22kgs. In millions of tonnes, this translated to 1.6m tonnes of demand in China compared with 22.2m tonnes in the developed world.
In 1990, China’s per capita income was just $350 versus $18,000 in the developed world.
But by the end of last year, China’s per PE consumption had reached 26kgs against 32kgs in the developed world. This amounted to 38.3m tonnes of Chinese demand from a population of 1.45bn people compared with the developed world’s 37.5m tonnes of demand from a population of 1.14bn people.
Here is the thing, also: In 2022, China’s per capita income was still only $13,000 compared with $48,000 in the developed world. China’s per capita income level was therefore nowhere close to being middle class by rich-world standards.
Demographics, climate change and plastic waste
Now that China’s ageing population is broadly recognised as a major challenge (12 years too late), attention is turning to more youthful populations elsewhere as offering big potential.
But we can hardly ignore climate change, as I discussed in my blog post on India last week. Despite its youthful population, increased floods and droughts are major economic challenges for India. Three fourths of its workforce are estimated to work outdoors.
And we can hardly ignore the plastic waste challenge. No matter how youthful a population, re-use and redesign will likely eat into PE and other polymers consumption growth.
“Dematerialisation has been commonly defined as the reduction of material used, be it per finished product (kg/kg) or per unit of economic output (kg/$), unit of power (kg/W), performance, or service delivered,” writes Science Direct.
Therefore, even if the most important PE market in the world manages to get past its demographic and debt challenges, I see China’s PE consumption growth as having peaked – and it might well decline.
If China succeeds in escaping its middle-income trap, it seems probable that this will be via building a much more environmentally sustainable economic growth model. The rest of the world is heading in this direction, so this is the way China can export higher-value goods and services.
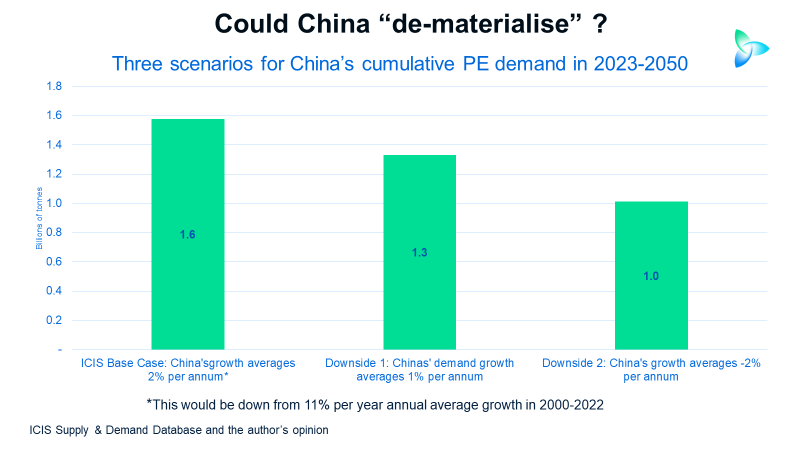
See below a guesstimate of what dematerialisation could mean in China as “less is more” reduces PE consumption from now until 2050.
The ICIS Base Case is already very conservative, assuming an annual average China PE demsnd growth of just 2% per year between 2023 and 2025 compared with 11% in 2000-2022. But I see average growth of only 1% or even minus 2% as perfectly possible.
And as this blog post has demonstrated, China’s consumption of PE (the same applies to all other petrochemicals) grew too quickly relative to the size of its population and its per capita incomes. This was because of the one-off historical events detailed above.
So, instead of asking the question, “Why should China’s PE demand go negative?”, I believe we should instead be asking ourselves why growth “shouldn’t” turn negative? I am struggling to find reasons why it shouldn’t.
I believe that what applies to China will apply to other countries and regions as sustainably pressures build. More on this theme in future blog posts.