By John Richardson
THIS MIGHT BE just the beginning of a long-term big increase in China’s great polypropylene (PP) exports as it becomes a major global player to rank beside the Middle East, Singapore, Thailand and South Korea, as the chart below suggests.

What you can see from the chart is that China cast its PP export net much wider in 2021 and In January-October 2022 compared with 2020.
Vietnam has remained the biggest destination for China’s PP exports because of the close downstream manufacturing relationship between the two countries and because of the ASEAN-China free trade deal. But Vietnam’s importance has diminished.
The same free trade deal also helps explain why Indonesia, southeast Asia’s second-biggest PP importer behind Vietnam, was in the top ten in 2020-2021 and in January-October 2022.
Into the top ten for the first time in 2021-2022 came countries such as India, Pakistan, Bangladesh and Turkey. Destinations as far way as Brazil, Guatemala and Peru also made the top ten.
One obvious reason why China has spread its net wider is rising self-sufficiency. Local capacity grew by 13% in 2021 over 2020. A further 10% capacity increase is scheduled for this year over 2021.
The other factor behind China’s wider range of export destinations is the extraordinary chart below.

As I’ve been flagging up since April 2021, Chinese PP prices (and the same applies to polyethylene) have never been as cheap versus the rest of the world since we began our price assessments. Or to put it another way, the rest of the world has never been as expensive compared with China.
The chart averages India, Indonesia, Vietnam Turkey, Pakistan and Brazil PP injection grade prices, along with Peru general-purpose PP prices. I then looked at this average price versus China CFR China PP injection grade prices to discover that:
- In 2020, the average price premium for these countries over China was $55/tonne.
- But it had risen $308/tonne between 1 January 2021 and 18 November 2022.
As I’ve discussed before, oversupply in northeast (NEA) has been trapped in the region because of the pandemic-related surge in container freight costs and the lack of container space.
But as you can see from the chart, price premiums over China – and therefore netbacks for Chinese exporters – have fallen off a cliff.
In November 2021, the premium reached a historic peak of $408/tonne. But in 1-18 November 2022, the premium was $113/tonne. Premiums have fallen in every month since April this year.
The price falls in 1-18 November versus October make for grim reading. Turkey prices were down by $63/tonne, India prices by $94/tonne with Indonesia and Pakistan prices $88t/tonne and $71/tonne lower respectively.
Vietnam prices were $98/tonne, Brazil price dropped by $55/tonne and Peru prices declined by $41/tonne.
Chinese prices fell by $35/tonne in 1-18 November 2022 over October, even factoring in an increase in the week ending 12 November compared with 18 November.
This has led to some good news for the well-established bg PP exporters. The fall in premiums has resulted in a sharp decline in China’s month-on-month PP exports from April this year, as the chart below tells us.

But before the exporters get too excited, it is worth also noting that some 1m tonnes/year of Chinese capacity is reported to be shut down right now for market and maintenance reasons. This compares with around 200,000 tonnes/year of recent start-ups of new capacity.
Temporary production tightness might thus also be a factor behind declining exports, along with the fall in netbacks.
The prospects for 2023 look increasingly alarming
Chinese PP capacity is set to increase by a further 16% next year. If this extra capacity happens and with local demand growth at risk of being negative next year, China’s exports may increase again.
An argument against a rebound in exports is if overseas price premiums over China continue to decline.
I’ve been warning that a decline would happen since April last year. I saw container freight rates moderating on a weaker global economy, making it easier to move oversupply out of NEA. This is happening.
I also flagged up at the time that China’s long-term economic slowdown would have a painful ripple effect across a global economy far-too heavily reliant on China. This is also what’s playing out right now.
Perhaps netbacks will be so weak that Chinese producers won’t be able to return to the export market with a vengeance, providing relief for the other exporters.
But consider the chart below which shows how historically weak China PP injection grade price spreads over CFR Japan naphtha costs have translated into the weakest naphtha-based and propane hydrogenation-based NEA margins on record. China, of course, dominates the NEA region.
Is this the future for profitability in other countries and regions as global pricing retreats closer to Chinese levels?

And even in the event of overseas price premiums continuing their sharp decline, we might still see Chinese PP exports come back strongly if local producers, backed by Beijing, take the long view. Raising exports could be seen as the right strategic move to add value to the economy.
Chinese export levels may also, of course, be heavily influenced by the strength of the yuan versus the US dollar.
Here is a reminder of my earlier chart, slightly updated, showing three scenarios for China’s PP net exports in 2023. The chart takes into account a slightly improved full-year 2022 demand growth outlook, based on the January-October data compared with the January-September data.
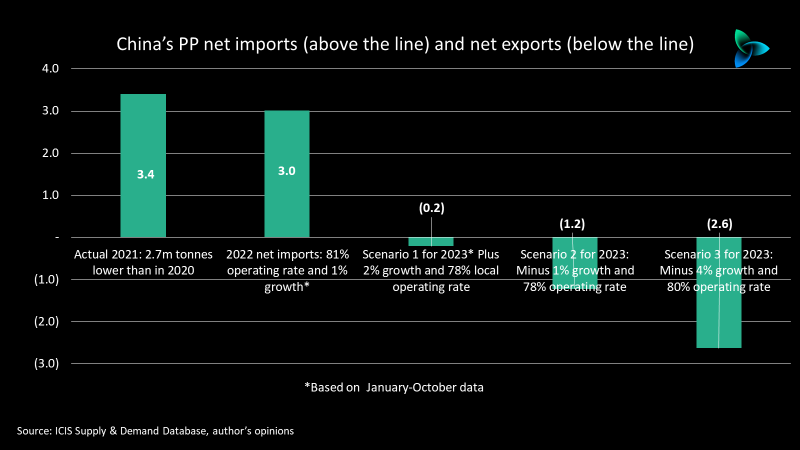
There is a risk that China becomes a net exporter next year. In 2021, it accounted for 42% of global net imports among the countries and regions that imported more than they exported.
Conclusion: There is also money to be made and saved in the downturn

You will have seen the above chart in several previous blog posts. It needs to be repeated because, as with other downturns, money can still be made and saved by correctly forecasting all the mini dips and rallies on the left-hand side the V-shape, as we head towards the bottom of this downcycle.
“Do I sell more in Turkey, India or China this month or do I instead cut back on overall production?” are the type of decisions you need to get right in order to generate vital revenues or save on feedstock costs with oil prices set to remain very volatile.
Better integration between the ICIS data platform and your IT platforms can help you achieve this. Talk to our technology team by contacting me at john.richardson@icis.com.
Equally important is informed opinions about what’s going to happen next. Again, contact me at the above email address for support from ICIS.
And finally, please be aware of false dawns, as we saw last week in China during the brief “real estate has been rescued and zero-COVID is being wound back” rally.
There is no getting away from the painful reality that we are a long distance from getting out of this trough, probably not until 2024.
Be cautious and prudent out there and we will get through this crisis together.