By John Richardson
I CANNOT emphasise enough the importance of petrochemical companies increasing their production and sales flexibilities as we head towards the bottom of what seems likely to be the deepest and most prolonged downcycle our industry has seen.
A razor-like focus on fluctuating netbacks and supply and demand among all the different countries and regions will allow producers to ensure that they don’t make product for markets where there is no demand, while ensuring that they take maximum advantage of many brief periods of stronger demand and pricing.
The chart below – which I’ve used before because it is critical – represents the downcycle (the left-hand side of the V-shaped trend) and the upcycle which, of course, is the right-hand side the V.

The history of previous industry recessions tells us that volatility increases on the way down to the basement.
This appears to be partly because of human nature. People don’t like to believe in the worst or most realistic outcomes, so in the past we have seen – and we are seeing today – brief surges in positive sentiment that boosts apparent demand.
An example was a week of slightly stronger pricing in China after this year’s Lunar New Year holidays. This was on what I see as the mistaken belief that there would be a big economic recovery following the end of the zero-COVID restrictions.
The risk for liquids-based cracker operators is that if they don’t show extreme geographic sales flexibility, while accurately predicting inter-regional market peaks and declines, they will suffer heavy raw-material inventory losses.
The good news for the polymers business is that the collapse of container freight rates means that shifting volumes around the world has become much more affordable. The polymers world – as I said would happen – has re-globalised.
Realism comes from the right data analysis
As I said, it is natural to want to believe that things are getting better, even if the fundamentals point in the opposite direction.
A good example are events the southeast (SE) Asian polypropylene (PP) market -the subject of the rest of this post. A quick glance at the next two charts might give reason for cheer.

The above chart compares monthly CFR SE Asia PP injection grade prices versus CFR China PP injection grade prices since both the ICIS price quotes began in November 2002 . The extreme right-hand side of the chart shows an increase in the southeast Asian price premium over China since January 2023.
The next chart might also give the impression that the southeast Asian market is seeing the beginnings of a sustainable recovery. The chart shows southeast Asian PP injection grade price premiums and discounts over China’s injection grade – again since our assessments began.

The southeast Asian premium reached a record monthly high in March 2022 of $222/tonne, when container freight was still very expensive.
But then the premium fell as freight rates declined, which allowed producers to more easily move oversupply in China to other regions.
By the end of last year, premiums were back to around their longer-term average. But they rose in January and February 2023, and for the week ending March 2023, premiums stood at $143/tonne.
Consider, however, this next chart. It shows annual southeast Asian PP injection grade price spreads over CFR Japan naphtha costs.

The spread so far this year of $368/tonne is the lowest annual spread since 2002 . Spreads do not lie. They remain one of the single best measures of supply and demand balances.
Now onto China the next chart, which shows what I’ve been warning about since 2014. China has added a great deal of PP capacity following Beijing’s “national interest” decision in that year to move to much greater petrochemicals self-sufficiency.
The 2014 vision was to become a net exporter in some products, and, as I shall discuss shortly, this could happen in PP by as soon this year.

ICIS is this year forecasting that China’s PP capacity will be at 118% of demand versus 70% in 2000 and 91% in 2014 – the year of that pivotal decision.
For reasons I’ve discussed before on the blog, I believe that China will see a tepid economic recovery in 2023 following the end of the zero-COVID restrictions.

The above chart shows my latest forecasts for China’s PP demand. Note that I’ve provided four scenarios, rather than the usual three, because of exceptional uncertainty.
I see 3% growth this year as the most likely outcome. This would be higher than last year’s 1% growth, but nothing like the virtual economic boom that’s been talked-up in financial markets.
How will we know, as the weeks move along, if I am right? It is again the spreads, this time of course in China. that will tell us the real situation.

China’s PP injection grade spread over naphtha costs are the lowest so far this year since the first full year of the ICIS price assessment in 2003.
Let’s put this into context: The $232/tonne spread up until 3 March 2023 compares with the 2003-2021 average annual spread of $546/tonne (we need to discount the 2022 spread of $244/tonne because last year was when the downturn began).
Here’s the thing: Until the China spread recovers to around $546/tonne there will have been no recovery. Period. That’s how this industry works.
In 2021, China was responsible for 42% of global net PP imports among the countries and regions that imported more than they exported.
Last year, China’s net imports fell to 3.2m tonnes from 3.4m tonnes in 2021. And in 2020, China’s imports were 6.1m tonnes.
We have reached a tipping point where only quite minor changes in operating rates and demand growth will make a big difference to China’s net imports or net exports in 2023, as the chart below illustrates.

Switching back to southeast Asia, new PP capacity is due onstream in the region.
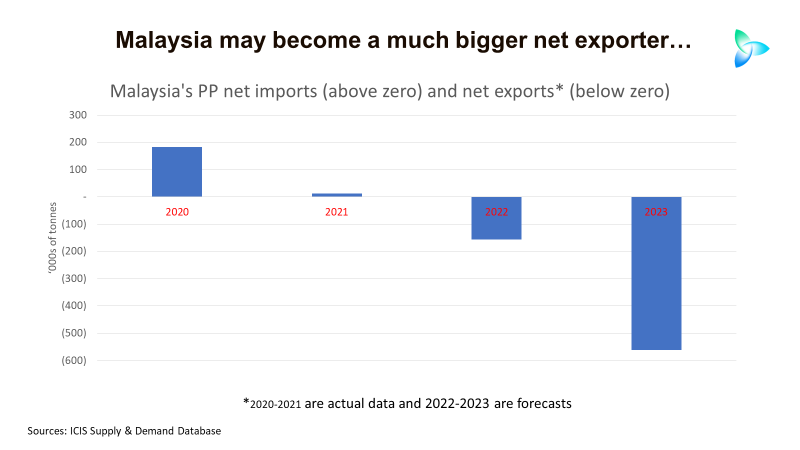
The long-delayed Pengerang Refining and Petrochemical complex may become fully operational in 2023. This could see Malaysia’s net exports rising to around 560,000 tonnes from an estimated 160,000 tonnes in 2022.
As the chart below shows, Malaysia was a net importer as recently as 2021.
Long Son Petrochemicals is expected to start up new capacity in Vietnam in the second quarter this year. We, as a result, expect Vietnam’s PP net imports to fall from 620,000 tonnes in 2022 to 420,000 tonnes in 2023.

Conclusion: Connecting the ICIS data sets and expertise together
These are the most volatile and difficult market conditions I’ve seen in my 26 years of analysing this industry. Friends and contacts, some of whom have worked in the industry for more than 30 years, tell me these are the worst conditions they have seen.
But human nature is hardly going to change. This means we will see many more temporary inter-regional market spikes as we head towards the bottom. but Please don’t lose sight of what the connected ICIS data is saying.
I should also add that it won’t be just stronger sentiment that drives brief recoveries. There will be pockets of genuinely stronger demand in certain PP end-use applications – and perhaps across all applications in certain regions. No downturn is ever entirely linear.
This requires producers to be much more global and flexible in their approaches, as I said at the beginning.
And the good news for PP is that there are many other important import markets aside from China, as today’s final chart tells us.

Stay safe and good luck out there.