By John Richardson
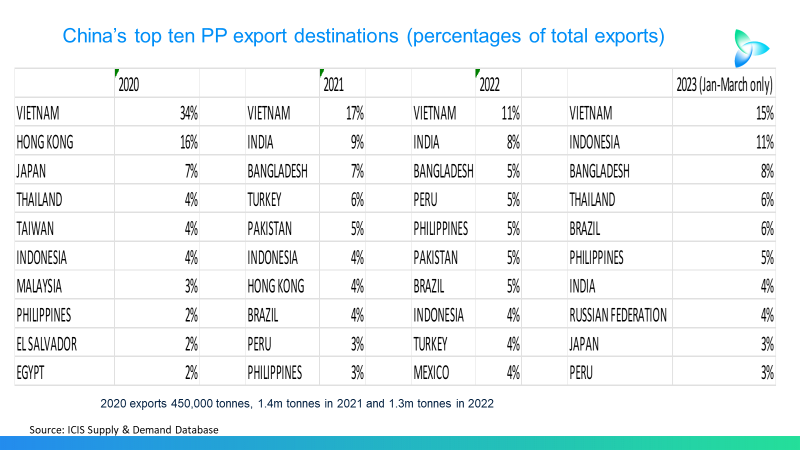
THE TABLE BELOW, from the trade data section of the ICIS Supply & Demand Database, shows the big shift in China’s polypropylene (PP) export patterns since 2020 to destinations further afield.
Growing overseas competition from China is occurring at a time of record global oversupply in petrochemicals in general.
Global PP capacity exceeding demand averaged 6m tonnes per annum in 1990-2020, according to ICIS, Capacity in excess of demand will be at 21m tonnes in 2023 and a 2021-2025 average of 18m tonnes a year.

How the other big PP exporters should respond in the short-term
Vietnam remains China’s No1 export destination with Indonesia also in China’s top ten in 2020-2023 because of the ASEAN-China free trade deal. This makes imports from China into the ASEAN region duty free.
But as you can see, the top ten destinations since 2021 have included India, Pakistan, Peru, Mexico, Turkey and Brazil etc, as China’s exports have increased.
In the short term, the well-established big PP exporters in Saudi Arabia, Abu Dhabi, South Korea, Singapore, Thailand and Taiwan will likely face even more competition from exports of Chinese homopolymer grades.
And why not eventually high-value copolymer grades as the Chinese producers handle more of the exports themselves? Right now, most China’s exports are of raffia grade and are handled by traders.
This would be the result of the chart below, which shows the rise in local capacities as percentages of demand.

As I said at the time, 2014 was the pivotal year of change for China’s petrochemicals self-sufficiency in general. It was then that Beijing decided to push much harder towards self-sufficiency for supply security and economic value-addition reasons.
In 2021, China’s PP capacity as a percentage of demand was above 100% for the first time. I believe this year’s local demand growth will be around 2% followed by 1% growth in each of the years 2024 and 2025.
Assuming the ICIS Supply & Demand Database estimates of new capacities are accurate in 2023-2025, this would see capacity as a percentage of demand at 121% in 2023, 132% in 2024 and 135% in 2025.
How should the big exporters elsewhere respond? As I’ve discussed before, and as the slide below reminds us, it is by competing more effectively across all the global markets. This will require a razor-like focus on fluctuations in netbacks and supply and demand in all the countries and regions.

Another challenge is that China’s PP imports are rapidly declining to the point where it might soon become a net exporter. This would be from accounting for 42% of global net imports in 2021 – among the countries and regions that imported more than they exported.
This makes the next chart highly relevant. Here I only compare Saudi Arabia with South Korea.

Not surprisingly because of geography, Saudi Arabia’s biggest PP export market in 2022 was Africa at 22% out of total exports of 5.1m tonnes. The same explanation is behind the 29% of South Korean PP exports that went to China out of total exports of 3.4m tonnes.
Clearly, therefore, South Korea has more work to do to hedge against the risk of further declines in China’s imports, as China’s exports also increase.
It doesn’t take a rocket scientist to compare my earlier bar chart with the tables immediately above. Competition in the Africa, India, Pakistan, southeast Asia, India, Pakistan and North and South America PP markets will surely increase.
The medium -to long-term approach for the PP industry in general
In the medium -to long-term though, I see the kind of standard analysis described above of diminishing importance because:
- China’s PP and other petrochemicals markets could well shrink because demand was artificially inflated by a one-off series of historic events. At the very least, consumption growth will be a lot lower than in the past.
- Demand elsewhere seems likely to be severely constrained by the economic, social and political damage from climate change.
We need to act very quickly – before we run out of our carbon budget.
“In 2021, the Intergovernmental Panel on Climate Change reported that if the world is to limit global warming to 1.5°C, its carbon budget – the cumulative CO2 emissions for a given temperature outcome – is 500 gigatonnes (Gt),” wrote Shell in the Energy Security Scenarios it released in March this year.
“This is based on a starting point of January 1, 2020, and gives a 50% likelihood of limiting global warming to 1.5°C,” continued the energy and chemicals company.
“By the end of 2022, around 120 Gt of this budget had been used, leaving 380 Gt. Annual global emissions were more than 40 Gt of CO2 in 2022, and are expected to be at around the same level in 2023,” said Shell.
Why dig more oil and gas out of the ground to make petrochemicals when the carbon cost is potentially ruinous for our climate? This might be a question increasingly asked by legislators, shareholders and the general public – rightly or wrongly.
Think here not just of the “standalone” carbon produced to makes petrochemicals and polymers and the emissions from shipping. Also consider carbon dioxide and methane leaking into the atmosphere from upstream oil and gas extraction, oil refining and natural gas processing.
Big efforts are going into reducing carbon emissions from steam crackers through technologies such as carbon capture and storage, electric furnaces run on renewable energy and small-scale nuclear reactors.
But will these efforts be enough to offset, as I said, emissions produced from upstream oil and gas extraction, refining and natural gas processing?
Is one of the routes to address the carbon challenge shifting our industry away from using oil and gas as feedstocks, to be replaced by technologies such as green hydrogen produced from electrolysis via renewable energy – along with a more limited role for chemicals and mechanical recycling?
From green hydrogen, we could make of course make synthesis gas (syngas) and from there methanol -one of the big building blocks of the petrochemicals industry.
Chemicals and mechanical recycling help us address the separate challenge of plastic waste. But I maintain that this challenge will never be adequately addressed until or unless we provide rubbish collection and storage systems to the 2bn people in the world who lack the systems.
As the title of latest Shell scenarios indicates, the Ukraine crisis has greatly increased energy security concerns.
Renewable energy is by its nature local, as wind, waves and solar are not transported across borders unlike oil and gas – although renewable energy can be moved via cables between neighbouring countries.
As for the separate challenge of plastic waste, the Basel Convention on plastic waste has restricted the movement of waste from developed to developing countries. Plastic rubbish must therefore be largely consumed in regions such as the EU as regulations also support the shift to greater plastic recycling.
“A souring of relations between America and China means rising geopolitical tensions, new trade barriers, a subsidy race, shifting supply chains and tighter restrictions on access to Western technology and data-sharing,” wrote The Economist in this 14 April article.
These are further reasons to believe that petrochemicals markets – or rather chemicals markets if we break the links with oil and gas – could become increasingly local, invalidating the “long distance cracker” as a business model.
Conclusion: From volume growth to growing value

The above chart summarises the main themes from today’s post.
So what if China becomes a net PP exporter? So what if its exports even extended to high-value copolymer grades? In the context of the climate challenges our industry faces, these developments would seem like small potatoes.
The petrochemicals industry needs to reimagine its entire business model as we move away from the pursuit of volume growth to growing value: The value of the solutions we provide to the climate and plastic waste crises.