By John Richardson
RECOVERY? WHAT RECOVERY? Some market players are talking about a rebound in the Chinese economy, and, therefore, polyolefins demand, but the critically important spreads data, as the chart below informs us, continue to tell a different story. Nothing has changed from last week.

The chart shows the spreads, or gaps, between CFR Japan feedstock costs per tonne and prices per tonne of polyethylene (PE) and polypropylene (PP). Spreads data remain a reliable way of assessing supply and demand balances.
I have again excluded low-density PE (LDPE) spreads from the above chart because they continue to perform well, not because of strong demand but because of very high pricing relative to linear-low density (LLDPE), which competes for many of the end-use markets.
My latest assessment of China’s LDPE demand, based on China Customs department net imports and our estimate of local production, points to a year-on-year 11% fall in consumption in January-April 2022.
LDPE has become very expensive relative to LLDPE due to cutbacks in LDPE production at LDPE/ethylene vinyl acetate (EVA) swing plants. This is the result of booming EVA consumption, particularly in the solar panels end-use market.
And anyway, demand for LDPE is the smallest among the grades. This makes what is happening in the other three grades of polyolefins much more important.
The above chart tells us that the average spread between CFR Japan naphtha costs and CFR China high-density PE (HDPE), LLDPE C4 film grade and polypropylene (PP) injection grade prices was $241/tonne in June, up until 10 June.
This is better than the $167/tonne spread in March 2022, which was the lowest since our price assessments began in November 2021. But the June spread is still lower than the previous record low of $259/tonne in December 2019.
The weak spread in December 2019 reflected the big rise in global PE capacity that briefly pushed northeast Asian PE variable cost margins into negative territory.
The ICIS PE margin assessments are another valuable tool. The margin assessments include production and logistics and costs, and co-product credits from selling propylene, C4 olefins and aromatics etc.
PE production cutbacks led to a rise in China PE spreads in early 2020, and then, of course, the pandemic happened. The pandemic greatly improved spreads from April 2020 onwards as China’s economy boomed on record growth in exports of manufactured goods.
But China’s polyolefin market today confronts high feedstock costs, the result of the Ukraine-Russia conflict, and the effect of the Zero-COVID lockdowns.
The economic optimism I referred to at the beginning stems from relaxation of lockdowns. Bu, as the latest spreads data appear to tell us, the economy has yet to fully re-open.
Doubts persist over the extent to which lockdowns will be relaxed during the rest of this year for political and health security reasons.
If you are still not convinced, look at the chart below which takes the same data included in the chart above, converting the monthly numbers into annual average spreads.
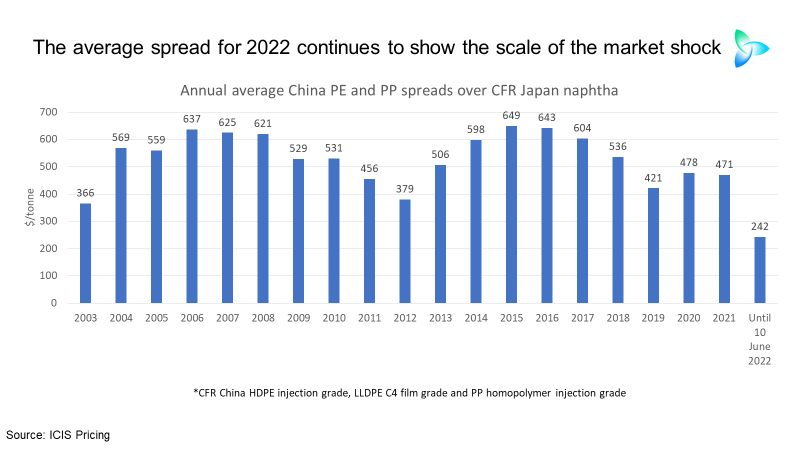
The annual average spread in 2022 was just $242/tonne, again up until 10 June. The previous record low was $366/tonne in 2003
The chart below reminds us that what is happening to spreads in 2022 is not the result of the rapid rise in oil prices and ergo naphtha costs.

The long-term history of actual naphtha costs and PE and PP prices shows that during previous rapid run-ups in oil prices, polyolefins exporters to China and local producers were much better able to pass-on higher feedstock costs to their customers than today.
The narrowing of the gap between the blue and red lines on the extreme right of this chart and the spreads data in the two earlier charts tell us that:
- The effective freezing of a large proportion of China’s economy because of the lockdowns has left exporters and local producers with reduced leeway to pass on higher naphtha costs. Even deep PE and PP operating rate cuts don’t appear to have made much difference.
- The market imbalances have been made worse by big increases in Chinese and South Korean PE and PP capacity. In China, the biggest increases due to take place this year are in HDPE and PP.
A continued razor-like focus on this type of data will help you block out the noise so you can understand what is really happening in China’s economy.