By John Richardson
THE GLOBAL polypropylene (PP) business is waiting with bated breath for the release of the January-February trade in late March. Since 2020, China has released the January-February data together.
So, we must wait until nearly the end of the first quarter to get an early steer on the strength of China’s imports and exports in 2023. This is just one example of an increasingly opaque Chinese market.
When the trade data has been released, we can add the ICIS estimates for local production in January-February to get an initial idea about how demand is shaping up for 2023 (demand equals net imports plus local production minus some end of year adjustment for over- or understocking).
We’ll still likely be very much in the dark, however, over this year’s China PP trade flows and demand. The reason is the impossibility of measuring the strength of consumer and investor sentiment now that the zero-COVID policies have been abandoned.
Nobody knows the degree of confidence in government policies, and how this will shape spending and investment, following the sudden decision to abandon zero-COVID in November last year.
And however sensitive this issue is to address it must be addressed. A 16 February New York Times article suggests that rough estimates indicate between 1m-1.5m people could have died since the zero-COVID restrictions were removed, much higher than the official numbers. How will this debate effect confidence in the economy?
Because the real-estate bubble may have popped for good, the old “put option”- that home and land prices will never fall – no longer applies. How will reduced confidence in the property market effect economic activity?
But the Financial Times, in this 15 February article, quoted Pantheon Macroeconomics’ chief China economist, Duncan Wrigley, as saying that this year’s Lunar New Year sales were 14% above the 2019 level, based on value-added tax receipts.
He added that domestic tourism trips during the holidays rose to 89% of the 2019 level, inflation remained mostly under control, and retail and residential property sales had improved.
But in another example of the almighty muddle out there, the Wall Street Journal, in this 13 February article, wrote: “The consumption recovery will be ‘shallow and short-lived’, according to Logan Wright, director of China markets research at Rhodium Group, a research firm based in New York. He predicts that after a quick surge in growth around the second quarter, the recovery in consumer spending will quickly lose steam.”
This explains the chart below, where, as with polyethylene (PE) and ethylene glycols (EG), I have four scenarios for China’s PP demand in 2023 rather than my usual three.

Major sensitivity to small changes in operating rates
The same wider range of outcomes applies to China’s net PP imports or net exports in 2023. This is the result of yet another year of scheduled large capacity increases in the context of the demand-growth uncertainties. China’s capacity is forecast by ICIS to increase by 14% in 2023 over 2022.

And because China’s capacity has increased so much since 2014, as I predicted would happen, minor changes in operating rates could also make a big difference to net imports or net exports.
The above chart uses the same demand growth assumptions as the first chart – either as much as 7% growth this year or minus 3%.
But if demand growth is as weak as minus 3% – and we are right in our base case assumption that the local operating rate will be 77% in 2023 – China could be in a net export position of some 300,000t tonnes.
The better demand growth outcome of flat growth and an 80% operating rate could, almost counterintuitively, lead to higher net imports of 600,000 tonnes.
And even if we see positive 3% growth, a repeat of last year’s 83% operating rate, this may lead to net exports of 900,000 tonnes.
In the event of my best-case outcome of 7% growth and again a repeat of last year’s 83% operating rate, we could see net imports of 500,000 tonnes. Even this best-case result would still be an awful lot worse than last year’s actual net imports of 3.2m tonnes.
Diversification is the key for the big PP exporters
Much better results than those in the above chart are perfectly possible from the standpoint of PP exporters to China. But exporters need to plan, plan and re-plan for a wide range of China outcomes.
They must also hedge their risks through deeper analysis of other markets. The chart below shows ICIS estimates for the size of the net import markets other than, potentially, China in 2023.

And as the chart below reminds us, China has become a major PP exporter in its own right. This is another area of essential, close analysis for the other PP exporters.
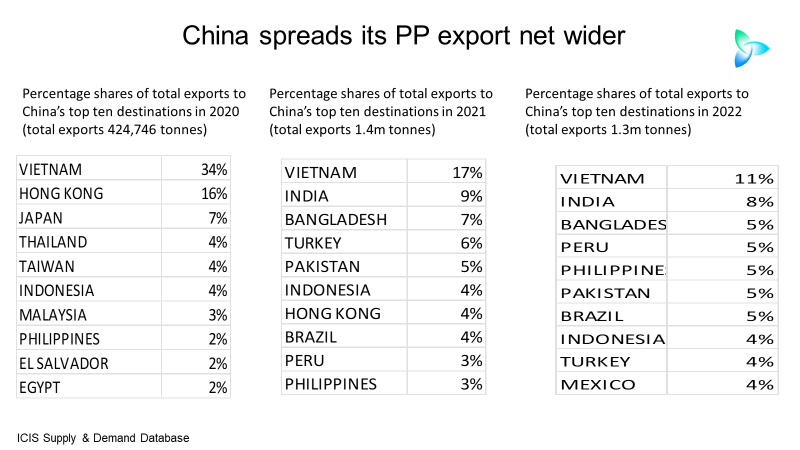
In 2020, 34% of China ‘s total PP exports went to Vietnam. But as China’s exports increased in 2021 and 2022, its producers spread their overseas net wider.
Vietnam has long been China’s top PP trading partner because the two countries are part of the ASEAN-China free trade deal. But the percentage of total Chinese exports that went to Vietnam fell from 34% in 2020 to 17% in 2021 and just 11% in 2022, as China’s producers spread their net wider.
As China’s exports have increased, new destinations have entered the top ten including Brazil, India, Pakistan, Peru and Turkey.
The next chart shows average monthly CFR PP injection grade price premiums between six of China’s top ten export destinations in 2022 – Brazil, India, Indonesia, Pakistan, Turkey and Vietnam – and CFR China injection grade prices since January 2019.

China’s month-on-month PP exports fell during most of the months from April until December 2022, reflecting a fall in overseas premiums over China. But, as you can, see, the premiums bounced back in January 2023 and the first half of February.
The better overseas netbacks seem to reflect a disappointing post-Lunar New Year PP market in China and more local capacity start-ups.
The chart underlines the need to maintain a razor-like focus of fluctuations in netbacks between all the different PP markets in order to make the right sales and production decisions.
We are likely to continue to see extreme volatility in netbacks because of the China PP demand and supply and global macroeconomic uncertainties.
Conclusion: Pulling all this data and analysis together
You need constantly updated ICIS data and analysis to stay on top of the PP complexities in 2023.
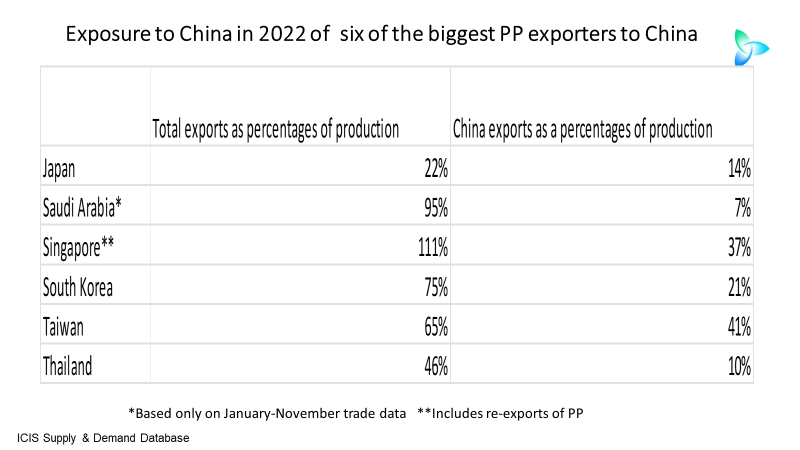
Who’s going to need this data the most? From a country and producer perspective, the above chart is helpful. The chart shows six of the PP exporters to China in 2022, their exposure to China and other export markets.
Only 22% of Japan’s estimated PP production in 2022 depended on exports in total, reflecting the country’ high demand, with Japan’s exports to China only accounting for 14% of its production.
Saudi Arabia, while heavily dependent on exports, had a very small exposure to China. Not so the other countries listed above with Taiwan the most exposed as 41% if its production was reliant on exports to China.
Note that Singapore’s total exports as a percentage of production was an unusual 111%. This reflected re-exports of PP as Singapore is a major trading hub.
So, you think ICIS is mainly a price reporting agency? Think again. The above data and analysis show how deep and wide our market analysis is.