By John Richardson
A BIG HOPE OUT there is that global inflation might have peaked and that, as a result, the West may only have to endure mild recessions.
As I discussed in my 8 February post, supply-chain related inflation has declined. Energy costs are down substantially from their peak immediately after the Russian invasion of Ukraine.
Despite the buoyant US employment report for January, investors parsing the tone of central bank statements still believe that while interest rates will continue to rise in 2023, the size of increases will shrink.
Combine this with the much-discussed China recovery after the end of zero-COVID and the roses seem to be budding in the garden in 2023.
But the chart below, provided by fellow ICIS blogger Paul Hodges, is a cause for concern that the flowers may not bloom. It indicates that US existing home sales are falling faster than during the Global Financial Crisis.

This supports Hodges’ argument that even if we do see a slowdown in the size of interest rate increases, previous periods of interest rate hikes have involved a lag effect; long periods before earlier rate rises started to damage end-use chemicals markets.
Housing is a major chemicals end-use market. This is both directly through the chemicals and polymers required to build and fit out houses, and indirectly via the conspicuous spending generated by rising real-estate prices.
Next, consider the quite stunning data in the chart below, which shows the global percentage shares by region of ethylene glycols (EG) demand between 1990 and 2022.

EG demand comprises consumption of mono-ethylene glycol (MEG), di-ethylene glycol (DEG) and tri-ethylene glycol (TEG).
The vast majority of overall EG demand consists of MEG. Returning to EG, no less than 91% of China’s demand in 2022 was driven by polyester fibres (it is MEG that’s used to make polyester fibres).
In 1990, China was responsible for just 5% of EG demand, but this had risen to 12% by 2000.
Note what happened between 2000 and 2002, however. China’s share of the global pie jumped from 12% in 2000 to 16% in 2001 and then 22% in 2002.
This was the result of China’s admission to the World Trade Organisation) at the end of 2001 that led to the removal of the tariffs and quotas that had restricted China’s apparel and non-apparel (clothing, sheets and pillowcases, etc) exports to the West. The same applied to China’s other manufactured goods.
The removal of the trade restrictions allowed China to take maximum advantage of what was then a youthful population and therefore low labour costs, along with its highly efficient export-based clothing and non-clothing manufacturing plants.
Another eye-watering chart about China
Meanwhile, the West was in the middle of a credit boom. This is likely to have driven a four-percentage point increase in China’s share of the global EG market between 2007 and 2008, as clothing and home furnishings flew off the shelves.
Then came the Global Financial Crisis. But this was immediately followed by China launching the world’s biggest economic stimulus package, maintaining the surge in China’s share of the global EG market.
And despite a rapidly ageing population, China’s exports of all manufactured goods are still worth some 20% of the country’s GDP.
China is also the world’s biggest exporter of polyester fibres, polyethylene terephthalate (PET) films and PET resins to factories in lower labour-cost developing countries such as India, Pakistan, Bangladesh and Vietnam.
So, we ended up with China accounting for no less than 61% of global EG demand in 2022 compared with just 33% in polyethylene (PE) and 41% in polypropylene (PP).
It isn’t that each citizen in China is walking around at any one time wearing ten shirts or blouses or are making their beds with 20 pairs of sheets.
A big percentage of Chinese EG demand is instead based on exports of apparel and non-apparel. Watch this space as in a later post, I will attempt calculations showing how many tonnes of EG this could amount to.
Meanwhile, consider another eye-watering chart below.

In 2000, EG global trade flow was a lot more balanced as only 32% of net imports among the regions that imported more than they exported were driven by China.
Asia and Pacific, which includes India and rest of south Asia, was only slightly behind China with northeast Asia ex-China (Japan, South Korea and Taiwan) in third place at 24%.
But last year, China was responsible for 80% of global net imports, with Asia and Pacific in distant second place at 9%.
Just to lay this on with a trowel – all of this tells us that it is was happens overseas that will determine the success or failure of the EG business in 2023 – indeed the whole of the polyester vue chain.
And there is no EG import market worth really talking about other than China’s.
The $4.3bn question for 2023
If you take the average ICIS CFR China MEG price for 2022, which was $574/tonne, and multiply by the tonnes of imports China recorded from its top ten import partners, you end up with $4.3bn of sales revenue.
We can then calculate the individual totals for each of the top ten import partners, as illustrated in the chart below.
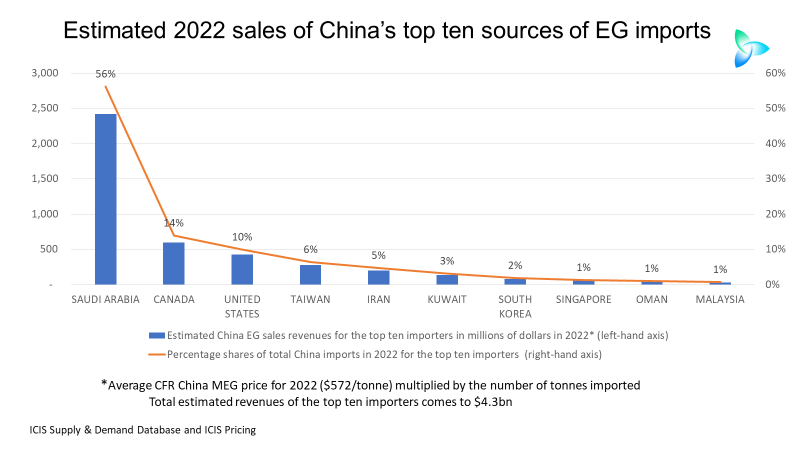
Saudi Arabia was in pole position in 2022, accounting for 56% of China’s total EG imports. Based on our average MEG price, this could have amounted to $2.4bn of sales.
Next was Canada with a 14% share of the China market and $600m of sales, followed by the US at 10% and $400m.
The total value of the sales of the top ten importers was $24.bn, based on my calculations. An awful lot of money is thus at stake this year.
Nobody has a clue about the strength of China’s economic recovery because we are dealing with an intangible that defies data analysis: the strength of local consumer and investor confidence.
I am with LyondellBasell in believing that the real, underlying strength of the recovery will only become apparent in 3-5 months’ time. And I worry that the optimists are going to be disappointed over the scale of the rebound.
As for the strength of China’s apparel and non-apparel exports, which is so important for the EG business, the same levels of uncertainty apply. I believe we will see a lag effect from last year’s interest-rate rises, as rising mortgage and other loan costs reduce spending in the West, after the “relief spending” that immediately followed the end of the coronavirus lockdowns.
Such are the uncertainties that, as with my 26 January post on PE, see below my wider-than-usual range of scenarios for China’s EG demand in 2023.

Normally, I only consider three scenarios: upside, medium and downside But the above chart involves four scenarios for 2023.
EG demand in China grew by just 1% in 2022, the lowest rate of increase since 2008 when the market contracted by 5%.
Let’s assume Chinese demand in 2023 roars back, growing by 10% – Scenario 1. This would leave consumption at some 22.2m tonnes.
Scenario 2 is the ICIS base case and involves 5% growth to 21.2m tonnes. Scenario 3 is 1R growth to 20.3m tonne and Scenario 4 involves a 5% decline (a repeat of 2008) to 19.2m tonnes.
The increased importance of tracking local operating rates
Regular readers of the blog would be familiar with the story conveyed by the next chart.
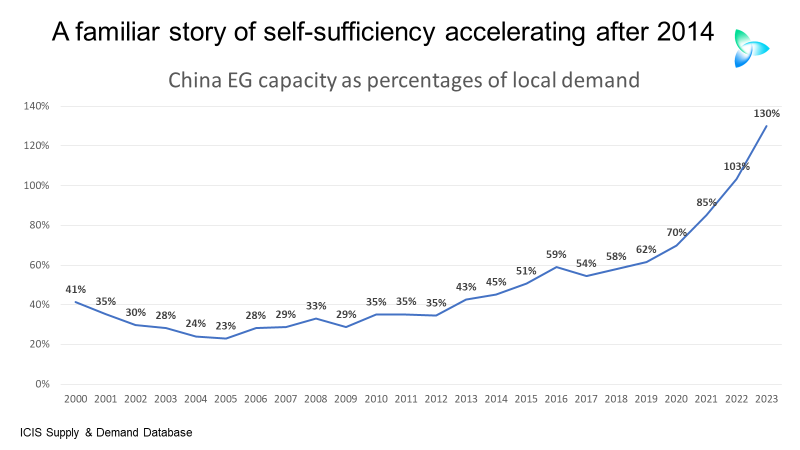
As I flagged up at the time, Beijing decided in 2014 to push much harder towards greater petrochemicals self-sufficiency. In 2014, just 45% of local EG demand was met by domestic capacity. This year, we expect that local capacity will account for no less than 130% of demand!
This of course indicates that too much capacity has been added too quickly in the context of weaker-than-expected demand. China also has a large amount of sub world- scale coal-based EG plants.
But as this excellent ICIS outlook article details, written by my colleague Cindy Qiu, several of the 2023 China EG start-ups will be world-scale, naphtha-based and well-integrated.
The average capacity of China’s EG plants has risen from around 200,000 tonnes/year in 2010 to approximately 370,000 tonnes/year in 2022.
This means yet more uncertainty I am afraid, this time relating to what plant economics and demand will mean for China’s EG plant operating rates in 2023.
See my scenarios below for China’s net EG imports in 2023. I have again provided four, rather than the usual three, scenarios.

Last year’s actual net imports were 800,000 tonnes lower than in 2021.
Scenario 1 for this year involves my best-case 10% demand growth and an operating rate of just 64%. Last year, the operating rate fell to 54% compared with a 2000-2021 annual average of 81%.
So, I am assuming that even under the best of economic circumstances, local operating economics will still mean modest capacity utilisation.
Under Scenario 1, net imports would be just 4.6m tonnes, reflecting the big increase in local capacity.
Cut demand growth to 5% and lower the operating rate to 60% (Scenario 2) and net imports would also be around 4.6m tonnes.
Because China’s capacity is forecast to be at 130% of demand in 2023, quite minor changes in operating rates can make a huge difference in net imports.
We see this in Scenario 3, where despite demand growth of only 1%, an operating rate of 54% results in net imports of 5.4m tonnes. And despite the 5% fall in demand under Scenario 4, cut the operating rate to 46% and you end up with net imports of 6.5m tonnes.
Conclusion: A myriad of complexity
It’s never been as complicated as this because there are so many moving parts.
But just because things are complicated, this doesn’t give EG producers, buyers and investors a get-out clause. They cannot afford to hold up their hands up and say, “It’s impossible to forecast 2023, so we just give up,” as many millions of dollars are at stake.
The good news is that I honestly believe that with the type of analysis above – and through the full suite of our integrated ICIS data and analytics services – we can come up with a good-enough view of 2023.
For information on how we can help, contact me at john.richardson@icis.com.