By John Richardson
A FURTHER BILLION dollars of polyethylene (PE) sales in China were lost year-on-year by the major exporters in January-July 2023 versus January-June 2023, according to my latest estimates.
These assessments make use of CFR China ICIS Pricing assessments and the China Customs’ department’s records – via our Supply & Demand Database – of imports from the big exporters.
The losses are summarised by grades of PE in the table below on the left. The table on the right uses the same approach to summarise the exporters who have gained rather than lost sales in 2023.
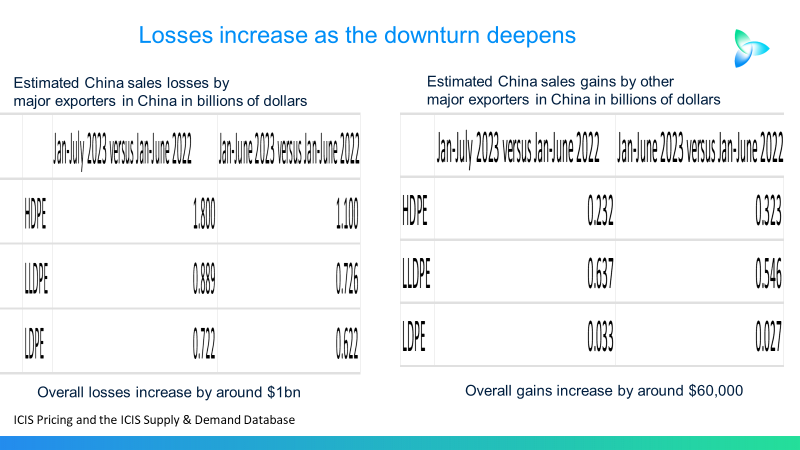
As you can see, year-on-year gains in January-July 2023 versus January-June 2023 were almost flat. When you look at the exact numbers, January-July 2023 was $60m ahead of the January-June period.
Now let’s break this down by grade of PE, this time using millions of dollars, starting with high density PE (HDPE).

The four biggest losers in January-July 2023 were Iran, Saudi Arabia, the United Arab Emirates and South Korea while the US was again a winner. The was unchanged from January-June.
H1 this year saw lots of turnarounds in the Middle East. So, perhaps the Middle East will regain ground later in 2023 as production recovers.
But some of the turnarounds are reported to have been brought forward because of poor market conditions.
Only the US might be equipped to continue to win in this very weak market because its producers run almost entirely on very low-cost ethane, whereas several of the crackers in the Middle East are mixed feed (ethane, propane butane and naphtha).
Total estimated HDPE losses year on year in January-July 2023 were at $1.8bn, up from $1.1bn in January-June. A further sign of deteriorating market conditions was that US sales gains fell to $223m from $323m.
Singapore’s petrochemicals exports account for over 90% of production because of its big capacities versus a very small domestic market. Its business model has so far worked fine because of booming Chinese demand. But what happens next?

Singapore’s linear low density (LLDPE) exporters saw their China sales slip by $308m in January-July 2023 versus the same months last year. Thailand was the second worst performer with losses at $159m. Total estimated LLDPE losses increased to $888m from $726m year on year.
There were four LLDPE winners in January-July.
Total estimated gains among these four winners rose to $637m in January-July from $546m in January-June.

Now let us move onto low-density (LDPE).
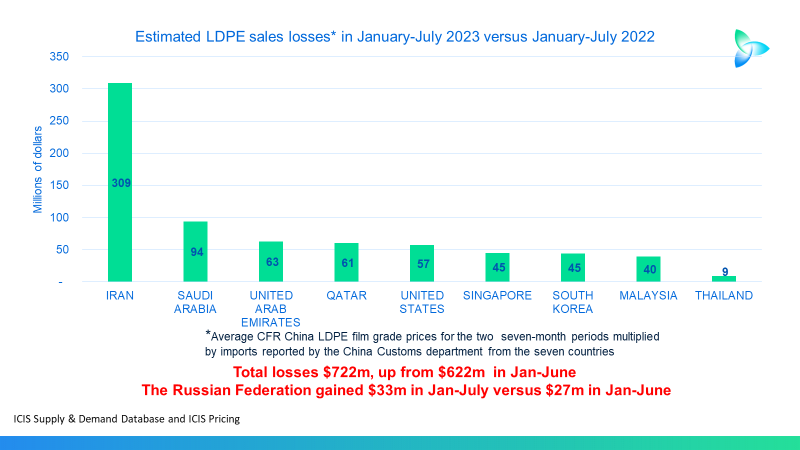
Total losses were up by $100m at $722m with only the Russian Federation gaining ground. Its sales gain was at $33m in January-July 2023 versus $27m in January-June.
Profitability also at record lows with no end to the downcycle in sight
Sales don’t equal profits, of course. But also consider the chart below showing the latest ICIS northeast Asian HDPE Cost Curve.

If you hover over our Cost Curves on the ICIS Dashboard – which cover a range of products in all the major regions – you can see estimated individual variable and fixed cost positions of each producer versus current market prices.
With the HDPE price at $880/tonne CFR NE Asia (the same as CFR China) in the week from 26 August-1 September – and with marginal producers assessed to require a price of $1,031/tonne CFR NE Asia – nearly all the region’s producers appeared to be losing money. It was a very similar story in LLDPE and LDPE.
Our Cost Curves were only launched in 2021. The chart below offers a much longer historical perspective.
Spreads are of course not cost curves or margins as they don’t include costs of production. But spreads – the gaps per tonne between product prices and raw material costs – remain a good measure of supply and demand balances.

So far this year, the average China CFR PE price spread over CFR Japan naphtha costs has been at $308/tonne – the lowest since our price assessments began in 1993.
One of the common mistakes made by inexperienced analysts is to assume that rising prices automatically indicate a stronger market. What matters more is the ability of petrochemical producers to pass on feedstock costs – again, in other words, spreads.
CFR China PE pricing for some grades has crept up the last few weeks as oil, and therefore naphtha, prices have risen.
But the average PE 2023 PE spread had declined by $10/tonne by 1 September compared with mid-August. This indicates no improvement in the supply and demand balance in favour of producers.
It is also instructive to look at average spreads between 1993-2021 and average spreads from 1 January 2022 (when the downturn began) to 1 September 2023 – the end of the latest ICIS Pricing reporting week.
HDPE spreads in 2022-2023 would need to improve by 104% to get back to their 1993-2021 level. LDPE spreads would need to increase by 44% and LLDPE by 78%. Average PE spreads would need to improve by 70%.
The next chart looks at China’s PE demand.

This year’s HDPE demand seems to be heading for a 2% decline, based on the annualised January-July data.
LDPE demand is in line to be flat whereas LLDPE consumption is heading for a 4% increase.
If these estimates prove correct, China’s total PE demand in 2023 would be lower than the ICIS Base Case Forecast by 1.2m tonnes.
Conclusion: Nobody should be surprised by these numbers
The PE producers that based their scenario planning on slogans such as “the rise of China’s middle classes” might be in trouble. Those who foresaw today’s events by taking into account demographics and debt could be fine.

The above chart – repeated from my 25 August blog – shows that global PE capacity between 2023 and 2030 might have to be 23m tonnes/year lower than the ICIS Base Case assumption to bring markets back into good balance.
This is based on 2023-2030 demand growth in the Developed World being flat with Developing World ex-China growth averaging 3.9% and China at 1.2%.
It is what it is whether you saw this crisis coming or not. Either way, ICIS is of course here to help you with the above data measures and many more.
Our constantly updated and integrated data sets will help you track where we are in this downcycle across every region – and across many of the petrochemicals and polymers. This will, in turn, support your budget, sales and production planning.