By John Richardson
THERE ARE rumours out there that as China focuses on carbon efficiency in a bid to hit peak emissions by 2030 – and because polypropylene (PP) spreads and margins are at historic lows – there will be a significant wave of PP plant closures in China.
It has also been suggested that as China focuses on carbon and economic efficiency, it has become harder to gain approval for new PP and other petrochemicals scheduled for start-up after 2025.
Beijing’s focus is said to be on encouraging the construction of extremely well-integrated world-scale petrochemical complexes that use carbon-reduction technologies such as electric furnaces and carbon capture and storage.
Let us assume all the above is true and think through what this might mean for China’s PP net imports or net exports from 2024 until 2040. This, of course, a crucial area for scenario analysis as China was, up until 2021, the world’s biggest PP net importer.
Either 5m tonnes of net PP imports in 2040 or 9m tonnes of net exports

The above chart presents three scenarios for China’s PP net imports or net exports in 2024-2040.
The ICIS Base Case involves annual average demand growth at 3.3%, an annual average operating rate at 79% and 26.8m tonnes/year of new capacity.
Alternative Scenario 1 sees demand growth at 1.5%, the operating rate remaining at 79% and the same amount of new capacity coming upstream as in the Base Case.
However, under this scenario, I assume that a total of 2.1m tonnes/year of plants with capacities at our below 100,000 tonnes/year are permanently shut down.
This would involve closure of all the plants in China that we have listed with capacities at or below 100,000 tonnes/year. In 2024, we estimate that this 2.1m tonnes/year would be 6% of total capacity.
Alternative Scenario 2 sees demand growth at 1.0%, the operating rate at 79%, 2.1m tonnes/year of plants shutting down and 13.4m tonnes/year of new capacity coming onstream – half of our Base Case total.
The above chart is again for demonstration purposes and should not be seen a substitute for the great work our consulting team can do for you, on a single-client basis, in studies and in workshops.
But it does illustrate that – as in high-density polyethylene (HDPE) – how worse-than-expected demand growth outcomes could, from the perspective of exporters to China, far outweigh the benefits of reduced local capacity.
Under our Base Case – which is an essential starting point for scenario work – we see China remaining in a net-import position throughout the forecast period. We see net imports increasing from around 2m tonnes in 2024 to 5m tonnes in 2040.
Alternative Scenario 1 would see net imports at just over 1m tonnes in 2024. But by 2024, China would be in a net export position of 6m tonnes.
If you take demand growth down to 1% – even with the plant closures and 50% less new capacity than the ICIS Base Case – Alternative Scenario 2 involves net imports of just under 1m tonnes in 2024 and net exports of 9m tonnes in 2040.
It is a moot point whether there would be sufficient room for China to be a net exporter of either 6m tonnes or 9m tonnes of PP by 2040.
This depends on the impact of climate change on PP demand in developing countries, especially in equatorial countries that may not have the technologies and finances to compensate for the damage from increased flooding and droughts.
We must consider the upsides for global PP demand from new green applications. Just one example is the work that is being done to replace metal with PP in electric-car batteries. This could reduce the weight of vehicles, thus increasing the distances that can be covered between each recharge.
But we need to evaluate the impact of the battle against plastic waste on PP packaging applications. Re-use, re-design and regulations restricting or banning the use of single-use plastics could eat into global PP consumption, especially in the developed world.
And what will China’s PP competitive position be like in 2040 versus overseas competitors? Those with access to cheap oil and gas-based feedstocks – and with the abilities to build at new bigger scales and employ carbon-reduction technologies – could leave China as a laggard.
This might result in even more capacity closures than the 2.1m tonnes/year suggested above and less new capacity than the 50% reduction I assumed versus our Base Case.
As mentioned earlier, though China is also reportedly moving into the carbon-efficiency space while stipulating that new PP capacity must be at optimum scale, well-integrated upstream and in some cases, with advantaged feedstocks.
For example, Saudi Aramco plans to use its crude-to-chemicals technologies in two refining-cracker complexes in China with PP capacities downstream.
Further, don’t underestimate the role of state support for China’s PP industry. Exporting significant quantities of higher value and green PP, including co-polymer grades, may be seen as a way of China escaping its middle-income trap.
Prepare for lower-than-expected China demand growth
A risk we face is that China’s per capita PP consumption growth may have been temporarily boosted by the three events described in the chart below, which are in the past.

China’s ageing population, representing perhaps the world’s most severe demographic crisis, means that the export competitiveness gained from Deng Xiaoping’s economic reforms and World Trade Organisation membership is waning.
And as the deflation of the real-estate bubble has demonstrated, the debt-driven growth model no longer works. The model began in 2009 with the launch of the world’s biggest-ever economic stimulus package.
The next two charts tell an even more remarkable story. Here, I have converted per capita PP demand in the three mega regions – the developed world, the developing world ex-China and China – into millions of tonnes measured against populations.

In 1992, when Deng Xiaoping’s Southern Tour took place, China’s 1.2bn people drove 1m tonnes of consumption.
The developing world ex-China consumed 3m tonnes. This made sense as its population was a lot bigger at 3.2bn. The developed world was an awful lot richer. Hence, its 1bn people consumed 12m tonnes.
Just look at how the world had changed by 2022.

China consumed 35m tonnes from a population of 1.4bn. The far bigger developing world ex-China, with a population of 5.3bn, consumed 28m tonnes.
The developed world was still a lot richer than China last year, as, according to the IMF, its per capita income was $48,000 compared with China’s $13,000. But developed world PP demand was lower at 23m tonnes.
We know that, say, 30% of China’s PP demand represents exports of finished or semi-finished goods. But even if you take this 30% off China’s 2022 total and redistribute it to the other regions, China still punches way above the relative size of its population in terms of PP consumption.
This is, as I said, because of the historic factors that has inflated China’s demand. Could demand growth therefore even go negative in some future years? Might the best positive growth outcome be around 2% per year?
The chart below shows China’s percentage PP demand growth between 2000 and 2022. The legends describe what I see as the key events.

Here is the next chart which, in percentages again, shows our Base Case 2023-2040 growth forecasts (I’ve included 2023 on this occasion). These are compared with the growth rates used for the net import/net exports in Alternative Scenarios 1 and 2.

Whether we see a soft or a hard landing is, for me, the pivotal question.
A soft landing is premised on a big post zero-COVID rebound in 2023 and 2024, followed by a decline in growth.
My downsides assume that late 2021 was the economic tipping point. This marked the end of the property bubble and the launch of Common Prosperity.
Every year, the demographic challenges become greater. We can no longer say that China’s ageing population is something to worry about in the future.
A softer landing in 2023-2026 would create stronger cumulative growth momentum than the downsides in the later years up until 2040. This would play a big role in keeping China as a net PP importer.
The hard landings would have the reverse effect, even with lower capacities than the Base Case.
Conclusion: Go global and innovate to avoid the China risks
Everything might still turn out rosy in the garden, of course, as China’s demand growth comes roaring back. But I cannot personally see this happening.
PP producers should mitigate against the risk of me being right by doing two things with the support of ICIS:
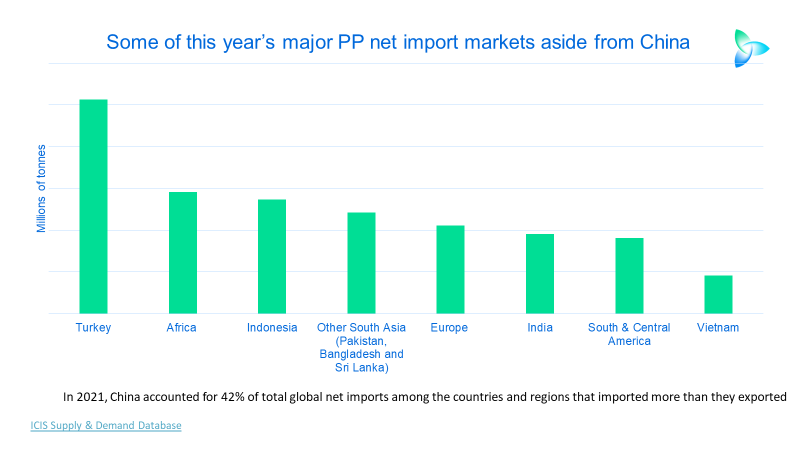
- Focus on all the other net import PP markets aside from China. The above chart shows estimates of the size of these markets in 2023, made at the beginning of this year. These estimates for every year going forward need to be revised via the ICIS trade data, our monthly or quarterly updated supply and demand estimates and netback analysis –comparing ICIS price assessments between different regions on a weekly basis.
- Innovate at the plant level to reduce Scope 1 emissions and in downstream applications (cutting Scope 3) such as the example I gave of PP replacing metal in electric-car batteries. I believe that as the environmental pressures continue to build – and because of lower-than-expected growth in China – the petrochemicals industry in general needs to develop a service as well as volume-growth business model. Contact me at john.richardson@icis.com and I can introduce you to our sustainability team.
Do not assume that we will return to the old world of easy volume growth when even the least-efficient PP plant made good money. This would, in my view, be a very costly assumption.