By John Richardson
BEFORE I BECAME a data nerd, I used to shuffle from conference presentation to conference presentation and believe this repeated story: The boom in polymers demand is the result of the developing world becoming “middle class”.
But when one dives into the numbers, as I did from 2009 onwards once I’d learnt how to open Excel on my laptop, this view no longer seems credible.
Using polypropylene (PP) as an example, let’s start to tell what I believe is the real story with the chart below.

This incredible demand growth story cannot have just been about the growth of a new middle class. Something much more complex must have been going on because:
- In 1990, both the developing world outside China and China itself had PP per capita consumption of around 1kg.
- By 2022, the developing world ex-China had reached 5kg of per capita consumption, but China was at an astonishing 35kg.
As the legends on the China trend line show, there were three pivotal phases in the explosion of Chinese demand versus much more moderate growth in the rest of the developing world.
Phase One was Deng Xiaoping’s tour of southern China in 1992, when he consolidated existing economic reforms and introduced new reforms as China allowed more private ownership of manufacturing.
But, as I shall describe later, the state continued to play a huge role in facilitating China’s very strong economic growth, which was mainly powered by export-focused manufacturing.
State support for exports, along with favourable demographics, reached maximum payback after China joined the World Trade Organisation in late 2001.
The tariffs and quotas that had restricted China’s exports to the West were removed because of WTO membership. This enabled China to take full advantage of its unbeatable cost position in export-based manufacturing.
Then came the world’s biggest-ever economic stimulus package launched in 2009 to compensate for the Global Financial Crisis.
A small number of Chinese citizens benefited hugely from the stimulus package, mainly through the property bubble that supported chemicals and polymers demand for direct use in building real estate.
Indirectly, polymers such as PP also benefited from an increase in conspicuous spending as that minority spent their real-estate gains.
Not convinced? Then look at this next chart which puts China’s rise in per capita PP consumption in the context of its per capita income levels. China is also compared with the developed world:
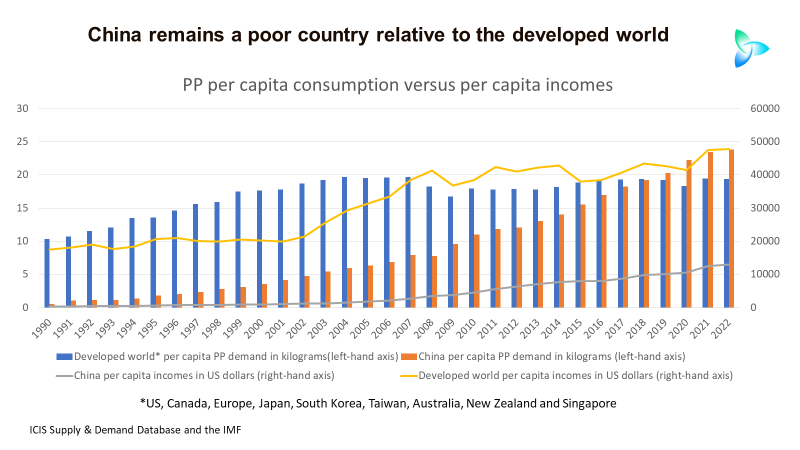
- In 1990, China’s per capita income was just $350 versus an average of $18,000 across my definition of the developed world. China’s per capita PP consumption was around 1kg versus 10kg in the developed world.
- By 2022, China’s per capita income had grown to $13,000 with, as mentioned earlier, per capita PP consumption at 23kg.
- But while the developed world’s per capita income had risen to $48,000, its per capita PP demand was 19kg.
Each Chinese citizen wasn’t consuming 23g of PP in 2022. Instead, a lot of this PP was being exported as components of or as packaging for finished goods.
And if one were able to somehow calculate the distribution of local PP consumption by levels of individual wealth, I am sure you would find a high concentration of demand in the richer provinces where the property boom took place.
China’s demographic and debt headwinds
The chart below shows the collapse of birth rates per woman from a peak of 7.5 in 1963 to just 1.2 in 2021, the latest year for which data is available.
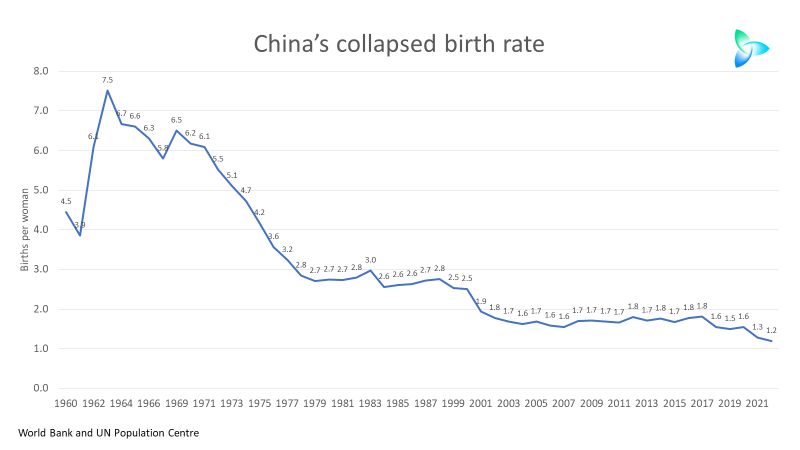
The babies born in the 1960s were by 2001 reaching their prime working years just as China won membership of the WTO. Cheap labour costs combined with strong state support for manufacturing, resulting in an export-led economic boom.
Another factor supporting China’s export-led boom – and thus its extraordinary increase in PP demand – were easy credit conditions in the West. This enabled Westerners to buy lots of competitively-priced goods made in China.
My generation, the Baby Boomers, also had little concern about the environment (guilty as charged). Our attitude was “spend and spend”, as ever-more consumption was seen as good.
The growth in the WTO and bilateral and multilateral trade deals further supported China’s export-focused growth.
But now everything has gone into reverse.
China’s working-age population started to shrink in 2014, and its total population last year declined for the first time since 1961.
As I’ve been warning for more than ten years on this blog, China is confronting the world’s biggest-ever demographic challenge.
As lower-value manufacturing increasingly drifts from China to lower-cost locations such as Vietnam and south Asia, the Baby Boomers are retiring as younger demographic cohorts take up the bulk of consumer spending.
“Less is more”, centred on concern over the environment, will, I believe, eat into chemicals and polymers demand growth as the younger cohorts dominate spending.
I should not entirely malign my age group. Older people are concerned about the CO2 and plastic waste crises. It is just that we weren’t as concerned during our prime earning and spending years.
There’s also been a significant tightening in the credit cycle because of inflation being at its highest levels since the 1970s.
The world is becoming less globalised as reshoring becomes popular for geopolitical and environmental reasons.
The growing rift between the US and China is also a threat to China’s export trade, if as a result China becomes unable to access the higher-value technologies it needs to move up the manufacturing chain.
Moving up the manufacturing value chain is essential for China if it is going to compensate for higher labour costs resulting from an ageing population.
Now consider this next chart.

Between 2000 and 2008, per capita consumption rose from 0.7kg to 11kg,mainly on export-led growth.
Given China’s ageing population, China’s per capita growth PP should have slowed down as it gradually lost its edge in low-value manufacturing – and as people saved more for their retirements. But it instead powered ahead because of the credit boom, increasing from 8kg in 2009 to 23kg in 2021.
The 2009-2021 lending boom was initially a response to the Global Financial Crisis, but then continued because of the “fear of stopping” – the risk that sudden curtailment of lending growth could cause a sharp decline in GDP growth.
The August 2021 Common Prosperity pivot was the point at which Beijing recognised that debt-fuelled growth no longer worked.
A lot has been made of a more relaxed approach to reining in debt following the end of the zero-COVID policy.
Bu debt-fuelled growth no longer works. You cannot keep building condos that not enough people want to buy because the population is ageing, and China is running out of new bridges and roads that need building.
“Don’t worry, though,” I can imagine some people saying, “China has very high savings rates resulting in huge potential for a much more consumption-led economy.”
But pension and healthcare costs are very high in China. As the population ages, this means more and more money will have to be put aside to meet these expenses.
A “what if?” view of the China PP market
Let’s imagine that there had been no Deng Xiaoping Southern Tour in 1992, no strong state support for manufacturing and no admission to the World Trade Organisation in 2001.
I don’t believe that a youthful population would by itself have led to China’s extraordinary PP demand growth, as much of the rest of the developing world had, and still has, youthful populations.
Let’s also imagine that China hadn’t launched its giant 2009 stimulus package and hadn’t stuck with mega-stimulus until the August 2021 Common Prosperity policy pivot.
See the chart below for what might have happened.

If you multiply the China per capita numbers by its population and convert from kilograms to millions of tonnes, you end with the blue line on the above chart – the record of what happened in the ICIS Supply & Demand Database.
If you take per capita growth numbers for the rest the developing world, again multiply these numbers by China’s population and convert to millions of tonnes, you get the orange line.
The cumulative difference in consumption between the two lines is 300m tonnes! In other words, if China’s economy had behaved like the rest of the developing world from 1990-2022, its PP consumption would have been 300m tonnes smaller during these years.
What applies to PP consumption in China applies to all other chemicals and polymers.
Conclusion: negative demand growth?
The risk is that 35kg of per capita PP consumption in China in 2022 – which translates into 34.6m tonnes, or 43% of global demand – could have been only temporarily inflated by success in exports and the credit boom.
China’s PP demand growth is seen by some analysts as moderating to 2% per year over the next 20 years, down from an annual average of 12% in 2000-2022.
But what if even just 2% growth is too high because demand was only, as I said, temporarily inflated? Could growth even be negative over the coming decades?
This is a possibility worth considering and shall be the subject of a future blog post when I shall gameplan some scenarios.