By John Richardson
CHINA’S POLYPROPYPENE (PP) import prices edged higher last week over the previous week on reports that supply had tightened and that the long-hoped-for bottom of declining Chinese demand had arrived. This flicker of optimism contributed to PP price rises in southeast Asia and Vietnam.
Or maybe the rise in import prices was mainly the result of restocking ahead of next week’s Golden Week, which runs from 1-7 October.
It would be wonderful to be able to believe that the turning point had finally arrived. But sadly, the chart below confirms we have a long way to go until the market returns to the Old Normal. Will the market ever return to the Old Normal?

The chart shows monthly average China PP price spreads over CFR Japan naphtha costs from when our price assessments in the chart began in November 2002 until the week ended 23 September 2022. As you can see, the September 2022 spread of $272/tonne was much lower than the longer-term trend.
Spreads are a rough measure of the extent of producer pricing power and therefore the tightness or length of any chemicals market. The higher the spread, the more easily producers can pass on their raw material costs to converters and vice versa.
Now let us look at the monthly trends since November 2002 in terms of actual China PP prices and CFR Japan naphtha costs. This chart is also very illuminating if you look at the gaps between the red line (PP prices) and the blue line (naphtha costs). The gap so far in 2022 is the narrowest in the history of our assessments for the longest period of time. There was a narrower squeeze around during the Global Financial Crisis, but that was very brief and really inconsequential as markets quickly recovered.
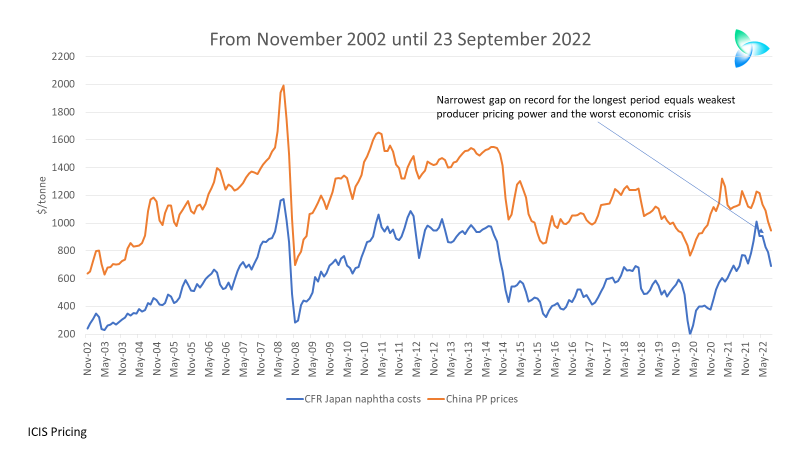
Rapid run-ups in crude prices and so naphtha costs are nothing new. But the wider gaps during previous rapid run-ups tells us that that something very different is happening during this downcycle.
China’s PP-naphtha spreads have aligned with economic growth
Because chemicals and polymers are key manufacturing building blocks, they tell us about both chemical industry fundamentals and macroeconomic trends. Let me illustrate this point by going through what the first chart in this post tells us:
- The previous lowest PP-naphtha spread was $352/tonne in December 2019, when it seemed as if a broad chemical industry downcycle had begun because of overbuilding.
- But spreads then began the climb to a recent high of $715/tonne in March 2021. This was the result of big PP production cuts in early 2020 followed by China’s export-led recovery from the pandemic. There was also a temporary upsurge in economic stimulus by Beijing to counteract the pandemic.
- Spreads then began to decline as China’s economy slowed down and as more new local PP capacity came on-stream. Between April 2021 and February 2022, spreads averaged $444/tonne. This 11-month average compared with what was at that time the lowest annual average spread of $447/tonne (see the slide below) in 2012. April 2021-February 2022 was therefore an early indication of more difficult times ahead.
- Spreads collapsed to an all-time monthly low of $216/tonne in March 2022 on China’s Common Prosperity economic reforms its zero-COVID policies and the surge in oil prices resulting from the Russian invasion of Ukraine. Local PP capacity is scheduled to increase by a further 11% in 2022 to 38.4m tonnes/year. From January 2022 until 23 September 2022, spreads averaged just $264/tonne, an annual all-time low.
What happens next? China will continue with Common Prosperity and zero-COVID as evidence starts to emerge of the effect of the global inflation crisis on its export trade (see the next section of this post). Spreads will, I believe, therefore remain at or close to historic lows for the rest of this year, and probably throughout 2023 as well.
It is possible, of course, that steep operating rate cuts and delayed start-ups of new plants push spreads closer to their long-term averages. But probably the largest-ever operating rate cuts took place in Q1 2022. China production cuts amounting to some 25% of capacityfailed to prevent spreads from sliding. This suggests to me that the main problem is demand rather than supply. Demand could get worse.
The chart below shows annual average China PP spreads from 2003, the first full year of our assessments.

As the title of the slide says, until we see a recovery in spreads over around a 12-month period to close to long-term annual averages, there will have been no complete rebound in China’s PP market. The spread so far this year at just $264/tonne is 41% lower than the previous lowest year of $447/tonne in 2012.
China’s demand still heading for a 1% decline in 2022

The latest China PP imports and exports, for August 2022, were published late last week. Add net imports for January-August to the ICIS January-August estimate of local production, divide by eight and multiply by 12 and you get a full-year demand number of around 34m tonnes (see Scenario 2 in the above chart). This would be 1% lower than last year’s actual consumption. This 1% decline is unchanged from what the January-July net import and production data suggested.
As always, I’ve provided two other scenarios for this year’s China PP demand based on three percentage point variances around Scenario 2. The best-case outcome, Scenario 1, would be positive 2% demand growth, still a lot lower than the 5-6% growth that had been widely expected at the start of the year. The worst case, Scenario 3, would involve a 4% decline growth.
Even a 1% decline in growth would be the second-worst annual fall in growth since 2000, the worst being the 2% contraction that occurred in 2008.
The risks to China’s crucial export trade
A 26 September article by Forbes, quoting a Capital Economics study, makes the point that I’ve been making since mid-2021, when China’s economy began to slow down:
“The financial world’s focus on a generational surge in inflation in advanced economies is stealing attention from a generational slowdown in China that is arguably of much greater importance for the long-term global outlook,” quotes Forbes from the Capital Economics study.
Exports of raw materials from South Korea to China fell during the first three weeks of September, which the Capital Economics report said was a sign that overseas demand for Chinese consumer goods was declining. This could add to the downward economic momentum already being caused by the Common Prosperity reforms and the zero-COVID policies.
Some good news was that August China retail sales growth beat expectations. But this 27 September Reuters article reported a 2.1% fall in China’s industrial profit the first eight months of 2022 from a year earlier compared with a 1.1% drop logged in January-July.
Morgan Stanley, in a research note quoted in the Reuters report, said it expected a “Spring 2023 reopening” of China’s economy because of more economic stimulus. But how effective would additional stimulus be given the headwinds of Common Prosperity and zero-COVID? China cannot step back from either of these policy initiatives.
But you don’t have to take my word for it. Instead, just follow the spreads data
To add to my weekly price indexes, comparing high-density polyethylene (HDPE) and PP prices in China versus a group of other countries and regions, I am considering starting a composite spread index. This would probably look at monthly changes in average PE, PP and other synthetic resin spreads over naphtha costs. We would then have an index pointing to the strengths of a wide range of manufacturing chains in China.
Spread analysis tells us so much about is happening in any region and in any chemicals and polymer. You therefore don’t need to take my word for what I think will happen next in China. You instead just need to follow the ICIS pricing data.