By John Richardson
SECURITY OF SUPPLY is a critical concern for European polyolefins producers and buyers because of the risks of interrupted Russian oil and gas supplies. You cannot, of course, run polyolefins plants without sufficient energy supplies.
So, in order to support European readers of the blog, let me start with some headline energy supply factors to consider when building scenarios for interrupted plant operations.
I will then dive into the excellent ICIS Supply & Demand data, along with some scenario work, on potential European production shortfalls in polyethylene (PE), what this could mean for increased import requirements and how any such requirements might be met.
Because this will involve a large amount of data and multiple scenarios built from the data, I will look at European polypropylene (PP) in a later post.
What is vital in this chaotic environment is to plan, plan and replan, literally by the day because, as you know, the situation is so fluid. This extra time spent planning could save or make you many millions of dollars.
Headline energy issues to consider
While we know that Russian supplies some 40% of Europe’s natural gas needs, percentages vary by country with, of course, polyolefins capacities also varying by country.
So, what’s required are country-specific breakdowns of dependence on Russian gas versus polyolefins capacities.
We also need to understand, cracker-and-polyolefins site by cracker-and-polyolefins site, the degree to which each complex is dependent on central grids versus their own electricity supply – i.e. cogeneration plants.
We also need to understand the degree to which, country by country, any loss of Russian natural gas supply could be offset by increased use of coal, fuel oil, nuclear energy, renewables and imported liquefied natural gas to generate electricity.
We know that 50% of European naphtha is supplied by Russia. We also know that around 27% of Europe’s oil comes from Russia. It is thus important to map which refineries this the naphtha and oil flow to and the polyolefins capacities downstream of the refineries.
We also know that the Druzhba oil pipeline runs from Russia to Hungary, Poland, the Czech Republic, Slovakia and the former East Germany. Some 2.79m tonnes of ethylene (11% of total European capacity) and 2.34m tonnes of propylene (12% of total European capacity) are reliant on refineries located along the Druzhba pipeline.
While some alternative sources of crude oil could be sourced, it is unlikely normal levels of operations could be maintained if Druzhba crude supplies were interrupted.
Europe’s 2022 PE net import and net exports
The slide below focuses just on the EU plus the UK. As you can see, the slide only provides our base case data for all these countries put together.
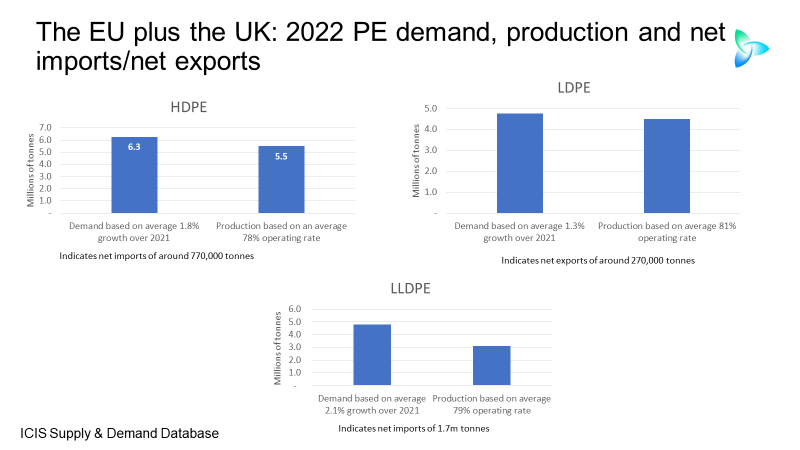
What is missing here is country-by-—country analysis of net imports and net export across each grade.
The EU plus the UK could be in a big net linear -low- density (LLDPE) import position (imports minus exports) of 1.7m tonnes/year.
It is critically important that Europe has enough LLDPE supply, as LLDPE is heavily used for food packaging –- as is also the case with low-density PE (LDPE).
But the EU plus the UK is forecast to be in a net export position of 270,000 tonnes in LDPE. One can therefore imagine an outcome where if local supply security was reduced, exports would decline.
High-density polyethylene (HDPE) is also used to package food, but not to the same extent as the other two grades. ICIS forecasts that the EU and the UK’s net imports will be 770,000 tonnes in 2022.
How might demand growth be affected by the Ukraine crisis? Such is the surge in the cost of living in Europe that we might even see consumption decline in food applications as shoppers reduce their spending.
We must remember that during the height of the pandemic, demand for packaging for food was higher than before the coronavirus because of more eating at home and less in restaurants – and big government stimulus that supported lower wage-paid workers.
In other words, European PE demand into food applications was always likely to be weaker this year than in 2021 as the coronavirus moves into what seems likely to be its endemic phase, even without the Ukraine crisis.
But I am sure more financial support will be on the way for European lower-paid workers, who are the most vulnerable to soaring food and fuel costs. This could support PE consumption in the same way that it did during the height of the pandemic.
But for the more limited quantities of PE that go into durable goods applications, there can surely only be downside for consumption as rising living costs lead to reductions in discretionary spending.
The demand outlook is clearly incredibly complex and needs constant monitoring through good on-the-ground market intelligence. Demand as much as supply will help determine whether Europe experiences any PE shortages.
What can be done very easily, however, is to take our base case data – presented in the slide above – and build scenarios on what could be Europe’s increased import needs in the event of lower-than-forecast operating rates.
We, for example, forecast EU and UK 2022 LLDPE capacity at 3.5m tonnes/year. Assume an average operating rate of 69% this year rather than our forecast of 79% and net imports would rise to 2.3m tonnes –- assuming our estimate of demand growth is correct.
The question would then become whether these extra imports would be available.
There should be plenty of PE available to replace any lost European production
I’ve reached the above conclusion because, as I discussed in this February post, barring further major US production losses, US PE exports are likely to increase in 2022. For your handy reference, see my three slides from the earlier post.


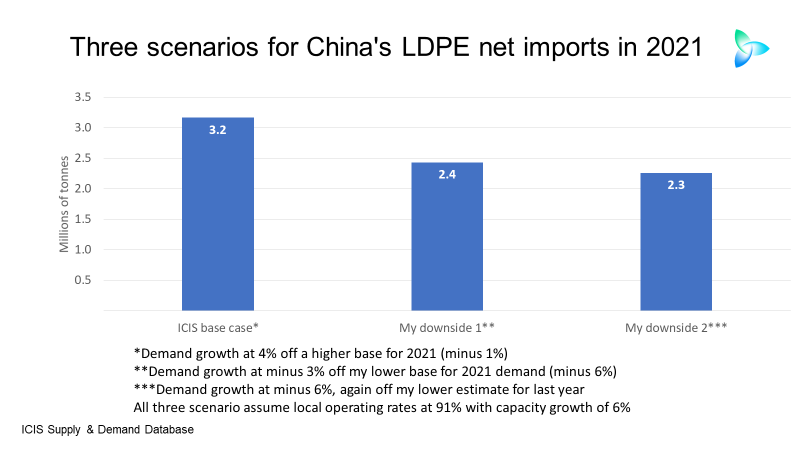
Another big variable to consider is the scale of China’s net PE imports (imports minus exports) as opposed to US exports, China faces a further economic deceleration in 2022 due to Ukraine, its Zero-Covid policies and the Common Prosperity policy pivot.
Combine this with a further increase in domestic capacities and high operating rates resulting from a.) the political push towards greater self-sufficiency and b.) greater availability of feedstocks from refineries, and I see as quite likely the downside scenarios presented in the three slides below.
These slides are again repeated from earlier posts for your easy reference.


We must also consider the likelihood that Russia will struggle to export PE in 2022 because of the sanctions. But Russia is, for example, only expected to account for 4% of global net HDPE imports in 2022 and plays similarly small roles in global LDPE and LLDPE markets.
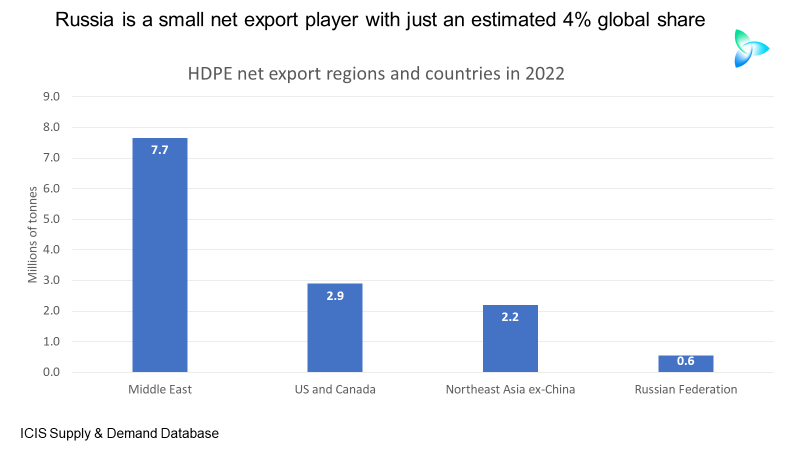
his doesn’t mean to say, however, that certain countries in Europe are not heavily dependent on HDPE imports from Russia, underlining the need to dig deeper.
Conclusion: This just scratches the surface
While, as I said, I believe there will be plenty of PE to go around to cover any European shortfalls, global producers need to act now to cover potential interruptions in supply commitments. European buyers must investigate further sources of supply.
This post –- even more so than usual because of these extraordinarily volatile times –- only scratches the surface.
I’ve only given you the questions to ask on European energy supply. Other issues I haven’t covered include PE demand growth in other regions, the extent of Middle East PE exports in 2022 – the world’s biggest export region – and how any cutbacks in Asian production might reduce PE supply.
As the quite shocking and final chart for today illustrates, cutbacks in Asian output seem very possible because of record-low margins.

For the week ending 4 March, northeast and southeast Asian integrated variable cost margins were -$571/tonnes and -$339/tonne respectively, the lowest levels since we began our assessments in January 2014.
While northwest Europe margins had declined, they remained in strong positive territory with US Gulf margins stable on the ethane cost advantage.
You need to do much more than scratch the surface. Contact me at john.richardson@icis.com and I can put you in touch with our energy and petrochemicals editorial and analytics teams.