My new post for the Financial Times FT Data blog highlights how household spending is very dependent on age.
This chart highlights how these trends have developed:
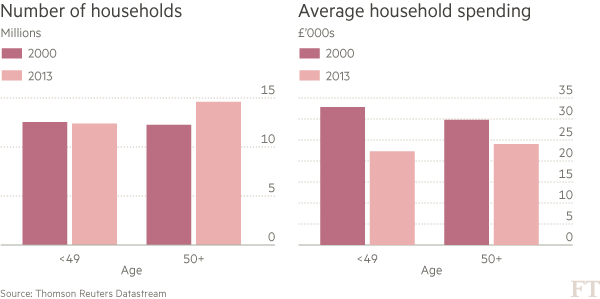
The majority of UK households are now headed by someone aged over-50. In 2013, there were 14.6 million in this segment, compared to just 12.3 million headed by the under-50s. These older households spend less that younger ones. Average spend by those in the older age group was just £24k in 2013, compared to the £30k averaged by the under-50s. As a result, total spending by the larger segment of 50+ households at £354 billion was slightly less than the smaller, younger segment’s $368 billion.
These trends seem likely to continue. The ongoing decline in fertility rates continues to reduce the size of the highest-spending cohort, those aged 30-49. Their numbers have fallen from 9.8 million in 2000 to 9.6 million in 2013. At the same time, increasing life expectancy has led to an increase in the size of the 50-64 age group from 6.2 million to 7.1 million over the same period. Even more remarkably, the number in the very low-spending 75+ cohort has jumped by almost a quarter to 3.6 million, and their average spend is less than half of the 30-49 cohort.
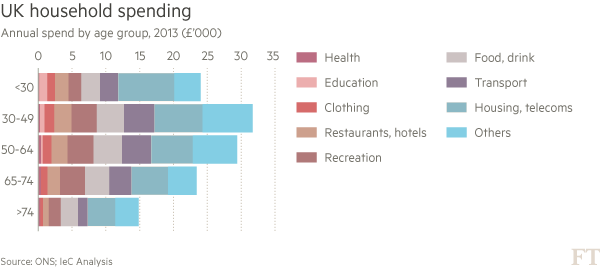
This chart highlights how spending declines across all major categories past the age of 50. Peak spending takes place in the 30-49 cohort, when people are settling down, often starting a family, and seeing their careers and earnings develop. But after 50, spending reduces as the children leave home and their incomes decline as they enter retirement.
The two largest areas, housing and transport, see an immediate decline as people move into their 50s. In others, such as recreation and food & drink, the decline is delayed until they reach 65+. Overall, total spend by the 50-64 cohort averages 93 per cent of peak spending, whilst spend by the 65+ cohort is only three-quarters of the peak.
It is hard to see how these trends can be mitigated by policymakers. Today’s 65-year-olds now benefit from an extra decade of life expectancy compared to 1950, when they were born. But no political party is likely to go into May’s general election with a promise to immediately increase retirement age by 10 years to balance this.
The ONS data thus highlights the major challenge faced by policymakers, as they seek to restore economic growth to the SuperCycle levels seen when the Baby Boomers were in their prime spending years.
Paul Hodges is the co-author of Boom, Gloom and the New Normal: How the Western Baby Boomers are Changing Demand Patterns, Again. www.new-normal.com