
If a country doesn’t have any babies, then in time it won’t have an economy. But that’s not how the central banks see it.
For the past 20 years, through subprime and now their stimulus policies, they have believed they could effectively “print babies”. Even today, they are still lining up to take global interest rates even further into negative territory.
But common sense tells us their policy cannot work:
- New data shows 2018 births in the G7 richest Western countries were just 7.8m
- This was the lowest level seen since records began in 1921
- It was even lower than at the height of the Depression in 1933 when births dropped to 7.99m/year
- By comparison during the 1946-70 BabyBoom, they averaged 10.1m/year and peaked at 10.6m
The chart above confirms the unique nature of the Western BabyBoom. Births jumped by 15% versus the previous 25 years, and since then they have fallen by an average 17%. Every single country is now having fewer births than at the peak of the Boom:
- US births were 3.79m last year, versus a peak of 4.29m in 1959
- Japan had 0.92m versus 2.7m in 1949; Germany had 0.79m versus 1.36m in 1963
The BabyBoom mattered because the Boomers were part of the richest society the world has ever seen. In 1950, the G7 were half of the global economy, and they were still 45% in 2000. The “extra babies” born during the Boom, effectively created a new G7 economy the size of Canada.
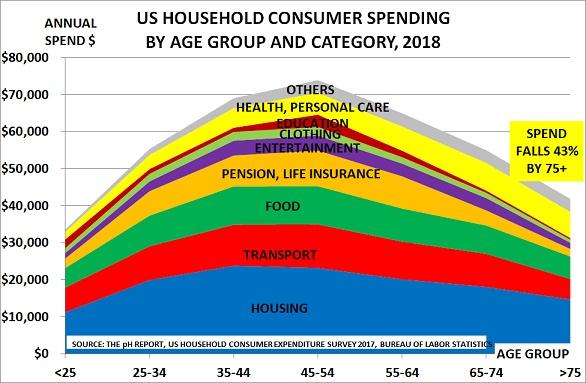
But since 1970, the West has not been replacing its population, as fertility rates have been below 2.1/babies per woman. This matters, as the second chart shows for the USA, the world’s largest economy.
Consumer spending is 70% of GDP, and it peaks in the 25-54 Wealth Creator generation – when people are building their careers and often settle down and have children. Spend then drops by over 40% by the age of 75.
This didn’t matter very much for the economy in the past, when most people died around pension age:
- In 1950, for example, there were just 130m Westerners in the Perennials 55+ age group. By comparison, there were 320m Wealth Creators and 360m under 25
- But today, there are 390m Perennials compared to 515m Wealth Creators and just 350m under-25s
This means it is impossible to recreate the growth of the Boomer-led SuperCycle.
Does this matter? Not really.
Most of us would prefer to have the extra 15-20 years of life that we have gained since 1950. But because policymakers have pretended they could print babies via their stimulus programmes, they were able to avoid difficult discussions with the electorate about the impact of the life expectancy bonus.
Now, this failure is catching up with them. Perennials are, after all, effectively a replacement economy. They already own most of what they need, and their incomes decline as they move into retirement. So we need to adjust to this major change:
- In 1950, it was normal for people to be born and educated, before working to 65 and then dying around pension age
- Today, we need to add a new stage to this paradigm – where we retrain around the age of 55, probably into less physically demanding roles where we can utilise the experience we have gained
- This would have tremendous benefits for individuals in terms of their physical and mental health and, of course, it would reduce the burden on today’s relatively fewer Wealth Creators
- It is completely unfair, after all, for the Boomers to demand their children should have a lower standard of living, and instead support their parents in the Perennials cohort

There is, of course, one other fantasy peddled by the central banks as part of their argument that monetary policy can always create growth.
This is that the emerging economies have all now become middle class by Western standards, and so global growth is still going to power ahead. But as the third chart shows, this simply isn’t true:
- It shows the world’s 10 largest economies (the circle size) ranked by fertility rate and median age
- Only India still has a demographic dividend, with its fertility rate just above replacement levels
- But India’s GDP/capita is only $2036: Brazil’s is just $8968 and China’s $9608
- By comparison, the US is at $62606, Germany is at $48264 and France/UK are at $42600
Companies and voters have been completely fooled by these claims of a “rising middle class” in the emerging economies. In reality, most people have to live on far less than the official US “poverty level” of $20780 for a 3-person household.
In China, average disposable income in the major cities was just $5932 last year, and only $2209 in the poorer rural half of the country. Its China’s great success has actually been to move 800m people out of extreme poverty (income below $1.90/day) since 1990.
Demographics don’t lie, and they clearly challenge the rose-tinted view of the central banks that further interest rate cuts will somehow return us to SuperCycle days.
Their real legacy has been to create record levels of debt, which can probably never be repaid.