By John Richardson
IT IS A FANTASTIC song from a great band. Another One Bites the Dust by Queen underlines the versatility of a band that could not be pinned down. They never stuck to a genre, but instead adhered with the strength of epoxy resin-based glues to excellent song writing and performing.
When analysing petrochemicals supply and demand in China, you need to demonstrate similar versatility, or rather rigorous scenario planning using ICIS data and analysis, to avoid very expensive mistakes.
Why this song title is relevant is that like polypropylene (PP) and styrene monomer (SM), phenol in China might be about to bite the dust as an export opportunity for overseas producers.
“No, impossible,” you might say and carry on with Plan A for your business. But many people said it was impossible for China to become completely self-sufficient in purified terephthalic acid (PTA). Five years ago, this is exactly what happened in a very short space of time.
Now let us look at what the data are telling us about phenol in China, starting with the chart below .

In January-October 2021 on a year-on-year basis, net imports were down by an eye-wateringly high 52%. Imports were 429,688 tonnes versus 573,272 tonnes a year earlier as exports surged to 98,831 tonnes from 13,680 tonnes.
The decline in imports and the rise in exports was the result of the 42% year-on-year increase in local production in January-October 2021. This was because local capacity is scheduled to increase by 17% in 2021 to 3.3m tonnes/year.
If you annualise the apparent demand data for January-October (divide by 10 and multiplied by 12), you get to demand for the full-year 2021 of around 3.3m tonnes. This implies a percentage increase over 2020 of 18%.
This increase in demand feels about right to me and is in line with the base case forecast in our ICIS Supply & Demand Database. But from 2021 onwards, my views diverge from the base case, as the chart below illustrates.

The base case 6% average demand growth in 2022-2031 is in line with historic averages. But I don’t see history as a useful guide to the future because of the Common Prosperity pivot.
Common Prosperity is about reducing the investment and commodity intensity of economic growth, with a particular focus on real estate, in order to tackle debt issues. Connected to this is narrowing China’s big income and wealth divide.
The policy pivot also involves lowering the carbon intensity of growth in order to hit the 2030 and 2060 CO2 targets, while making progress on cleaning up the air, water and soil.
Back to those super strong epoxy resin glues and epoxy-based coatings. They use phenol as a raw material and the slowdown in real estate means less demand as a great deal of the products are heavily used in construction.
The same applies to polycarbonate (PC), also part of the phenol value chain. And for non-construction related phenol end-use markets, I see growth moderating on lower GDP growth and the reduced commodity intensity of each percentage point of the GDP growth that will occur.
Government policies guarantee much greater self-sufficiency
This has led me to my two downsides in the above chart of either growth averaging 4% in 2021-2031 or just 2%.
Because this year’s growth will be so high at 18%, and because this is in the context of slowing long-term demand, I cannot see another outcome than a very different market in 2022. Phenol must be overstocked. Hence, I see negative growth a probable outcome for next year – part of my Downside 2.
The next chart shows our base case assumptions for China’s capacity growth in 2021-2031. This base case doesn’t include 760,000 tonnes/year of unconfirmed or speculative capacity going ahead, which is where projects don’t have approval, financing or feedstocks.

This seems reasonable to me as another objective of Common Prosperity is to reduce the investment intensity of the economy in general for debt and carbon emissions reasons. So, expect to see not just a slowdown in new real estate construction, but also in manufacturing capacity growth.
Note that after a further 29% increase in capacity next year and 26% in 2023, we see no further capacity increases up until 2031.
I believe upstream refinery restructuring, announced by Beijing in October, will lead to more availability of petrochemical feedstocks from refineries. This will result in greater availability of benzene and propylene to make phenol.
Another important group of government policies, under the headline Dual Circulation, involves greater self-reliance or self-sufficiency from imports of raw materials.
Combine this policy, which was introduced 2014, with more petrochemical feedstocks and lower-than-expected demand growth and one of the two alternative scenarios in the chart below could come true.

Actual operating rates averaged 88% in 2000-2020 as the average size of China’s phenol plants rose from 73,000 tonnes/year to 195,000 tonnes/year. Combine these better economies of scale with more availability of benzene and propylene feedstocks and the Dual Circulation self-sufficiency push, and you can argue that operating rates will continue to be around 88%.
But, as the next quite amazing slide shall illustrate, there is hardly any global net import market minus China. In other words, if China were to push its operating rates too high, driving itself into a big net export position, it would struggle to sell the volumes.
The two downside scenarios in the above chart therefore assume China attempts to run its plants at operating rates that achieve balanced positions. But this is incredibly, incredibly difficult, so I include years where China jumps into big net export positions. This would cause major disruptions to overseas markets.
Now look at the chart below.
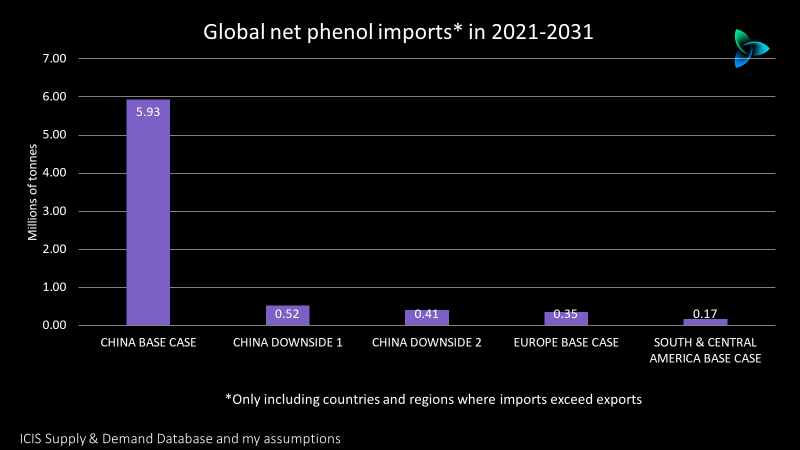
Our base case would see China accounting for 92% of global net imports in 2021-2031 with only Europe and South & Central America importing more than they export. Under this base case, global net imports would total 6.4m tonnes.
Under China Downside 1 (annual average demand growth at 4% and an operating rate at 84%), total global net imports would reach just 1m tonnes; under Downside 2 (annual average demand growth at 2% and asn operating rate at 76%), global net imports would be a mere 920,000 tonnes.
In either of these Downsides, as the final chart below shows, the world’s major exporters would face a pretty much existential crisis. Either 1m tonnes or 920,000 tonnes of global net imports would not fit at all into our base case global net exports in 2021-2031 of 6,5m tonnes.

Conclusion: no time for burying heads in sand
You might want to bury your head in the sand and you could get away with it. China’s phenol net imports may be at around 6m tonnes in 2021-2031.
But something important has happened to the ICIS Supply & Demand Database during the last two years. Now it is possible to make minor adjustments to our base cases for Chinese demand growth and operating rates to produce radically different outlooks for net imports/net exports.
This is a pivotal time for petrochemical companies heavily focused on exports to China – in the case of phenol, the companies in the Middle East and North America, as you can see in the chart above.
In my view, I can see no reasons why China will not move much closer to self-sufficiency in phenol, PP and SM with net export positions very possible.
What should you do next? Build alternative strategies based on the data and analysis on alternative markets to China. With phenol, thiscould involve converting more phenol into derivatives. I shall explore this option in a later post.