By John Richardson
AGAIN, PLEASE DON’T SAY I DIDN’T WARN YOU. Regular readers of the blog will not be surprised in the slightest by the chart below.

This is the first time northeast Asian (NEA) naphtha-based polypropylene (PP) margins have turned negative since we began our margin assessments in January 2014.
Propane dehydrogenation-based NEA PP margins were also at minus $11/tonne last week, but they have previously been negative.
Coal-based margins in China last week were at a very healthy positive $366/tonne, reflecting the fall in coal costs that I thought would happen because of government polices dealing with last October’s energy shortages. The government has pledged to keep coal supplies ample in 2022.
Why have naphtha-based margins fallen into negative territory then?
You can argue that this is because of higher oil prices. No, because in northwest Europe, also, most capacity is also naphtha-based but margins remain close to record highs.
The reason is instead much weaker supply and demand fundamentals in NEA compared with northwest Europe.
China’s capacity increased by 13% in 2021 over 2020 to around 35m tonnes/year. South Korea’s capacity was also 13% higher in 2021 over 2020 at 5.6m tonnes/year.
The 2021 capacity increases would have probably been fairly comfortably absorbed if it hadn’t been for the chart below, which includes my latest estimate for China’s PP demand in 2021 in the long-term historic context.

“But hold on,” I can again hear you say, “China’s demand still grew by 4% and at least it wasn’t negative, as happened in 2008, so the market can’t have been that bad.”
True, but most things are relative in petrochemicals. A lot of people had expected a similarly robust year of growth in 2021 as in 2020 (in 2020 demand expanded by 10% over 2019).
I never thought this would be the case because 2020 was a bubble year when China’s PP demand was supported by the surge in overseas demand for its finished goods, as China met the West’s lockdown needs. Bubbles always deflate.
What nobody had factored in was the impact on demand of the Common Prosperity policy pivot from August 2021 onwards. I believe that this led to last year’s 4% growth, the third lowest level of percentage growth since 2000.
This occurred as China ran its existing and new PP plants at an operating rate estimated by ICIS at 86% – – pretty high.
In 2020, China’s net PP imports totalled 6.1m tonnes. Last year, based on the latest available China Customs data for January-November, they look to have totalled around 3.5m around 3.5m tonnes, a decline of 44% when you look at the exact numbers.
China’s exports are in line to have been 1.4m tonnes in 2021, up from just 424,746 tonnes in 2020. South Korea’s PP capacity increases led to its net exports rising to 3.2m tonnes in 2021 from 3m tonnes in 2020, according to ICIS.
As always, of course, you want to know what happens next. Here is my outlook for China’s PP market in 2022.
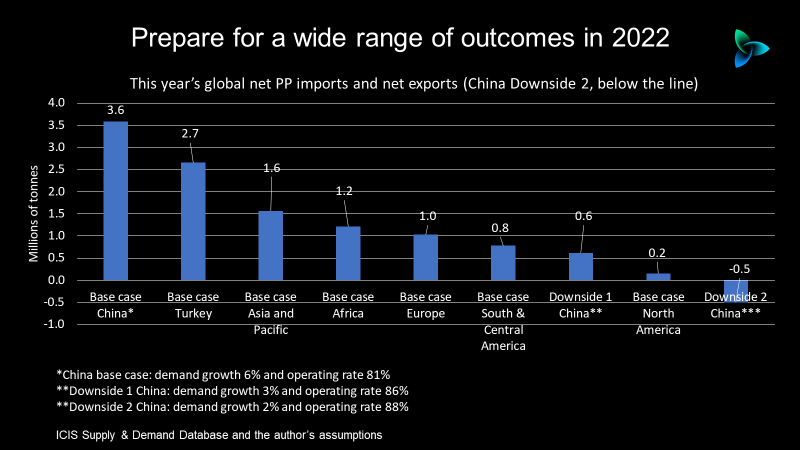
China in 2022: either net PP imports of 3.6m tonnes or net exports of 500.,000 tonnes
China’s PP capacity is forecast to rise by a further 13% in 2022 to 39m tonnes/year with South Korea’s capacity scheduled to increase by 12% to 6.3m tonnes/year 10% to 6.3m tonnes/year.
Our base case sees China’s demand growth at a healthy 6% in 2022 (note that in 2021, our base case is for a 7% rise in consumption versus my view of 4%).
We are also predicting a dip in capacity utilisation from our 86% in 2021 to 81% in 2022 as new plants are gradually brought on-stream and as the market absorbs the extra supply.
But what if demand growth were to fall to 3% on Common Prosperity?
In addition to my previous posts on this theme, I strongly recommend that you read this Financial Times article on the impact the policy shift is having on local governments.
China needs to raise more government revenues to narrow the big rural-urban income divide and pay for rising healthcare and pension costs because of a rapidly ageing population.
But as the FT article highlights, local governments are struggling to even maintain their current revenues because of the end of the real- estate bubble, as their tax generation largely depends on land sales. Local authorities are responsible for 89% of total government spending in China.
These are themes I shall return in detail later on. As for the here and now, falling local government tax collection is just one of the many eggs China needs to crack as it builds an entirely new omelette, or rather a new economic growth model.
The transition to this new model will, I believe, not be easy and will take several years, during which we should expect lower economic growth and thus lower petrochemicals growth.
The multipliers of Chinese petrochemicals growth over GDP also look set to decline, both in the short and long- term, as China tries to make its growth less commodity intensive for debt and environmental reasons.
We also need to consider Dual Circulation, another government policy headline which includes greater self-reliance.
Might China therefore run its PP plants in 2022 at 86%, the same rate in 2021? More feedstocks might be available to achieve this higher rate because of upstream refinery restructuring.
This leads to Downside 1 in the chart at the beginning of this section. Demand growth at 3% in 2022 and an operating rate of 86% leads to net imports of just 600,000 tonnes.
If you then cut demand growth to 2% and raise operating rates to 88% –- Downside 2 – -China swings into a net export position of 500,000 tonnes.
Downside 2 would be a slightly more positive outcome from an exporters’ perspective than I was predicting last December, as this latest estimate is based on more recent data.
What a turnaround either of these latest downside scenarios would be given that in 2021, China generated some 40% of global net imports among the countries and regions that exported more than they imported.
What’s also remarkable is that quite minor adjustments to demand growth and operating rates produce dramatically different net import and net export results. This reflects the rise in China’s PP capacity since 2014.
The above chart also tells us that under the ICIS base case, the global net import market in 2022 would total 11m tonnes. Downside 1 would see the market shrink to 8m tonnes and Downside 7m tonnes.
Conclusion: beware of deflation
NEA naphtha-based PP margins turning negative for the first time since at least 2014 is a pointer towards the deflationary or disinflationary impact that China could have on the global PP business, as I’ve discussed before.
Deflation or disinflation are topics I shall return to in later post. Right now, all the attention is on inflation, which is partly the result of supply disruptions.
High container freight costs and shortages of container space are actually a reason for the negative NEA PP margins, as the region’s producers are finding it harder to export their surpluses.
But supply chain tightness will ease as the world accepts and deals with the shift in coronavirus from being a pandemic to being endemic. Then NEA oversupply could more easily spread other regions.
As always, my scenarios in this post just scratch the surface and are for demonstration purposes only. For details on how we can provide you with detailed scenario work, contact john.richardson@icis.com.