By John Richardson
MOST people now accept that China’s real estate sector, worth some 29% of the country’s GDP, is deflating with significant long-term implications for petrochemicals growth.
But because China’s GDP growth is very likely to still grow and because China’ existing demand is already so big the common view is that there is nothing much to worry about. Even significantly lower percentage growth would deliver lots more tonnes of demand, it is assumed.
Using polypropylene (PP) as an example, the chart below, showing our increasing dependence on China for growth, doesn’t raIse major concerns for many people. Very similar patterns apply to all other petrochemicals.

But there are two problems with this conventional thinking.
Problem with conventional thinking No1: the link between the credit boom and the surge in consumption
Between 2000 and 2008, China’s PP demand grew by 129% from 4.6m tonnes to 10.5m tonnes. But between 2009 and 2021, as China’s giant economic stimulus programme came into play, consumption grew by 155% from 13.1m tonnes to 34.4m tonnes.
Consider the chart below which underlines the link between the rise in Total Social Financing, a measure of total ending in China from the state-owned banks and the private or shadow lenders, and the rise in PP per capita consumption. The correlation is around 80%.

As with demand measured in millions of tonnes, the big take-off in per capita consumption occurred after the big stimulus programme began in 2009.
Between 2000 and 2008, per capita demand rose by 118% from 3.6 kilograms to 7.8 kilograms. But in 2009-2021, per capita consumption rose by 132% from 9.6 kilograms to 22.2 kilograms.
The property boom, caused by the stimulus programme, was concentrated in China’s ten richest provinces
This greatly increased regional wealth inequality. China is attempting this problem through its Common Prosperity policy pivot, with Common Prosperity also involving a deflation of the real estate bubble in order to deal with an alarming rise in bad debts.
Now that the bubble is over, we need to ask ourselves where strong future growth momentum will come from.
The rest of China, outside the ten richest provinces, is much poorer and has a more rapidly ageing population due to mass migration of young people to the big coastal cities in search of work.
Northeast China has the added difficulty that it is China’s rust belt with lots of heavy industrial capacity that’s being restructured for overcapacity and environmental reasons.
Cleaning up the Rest Belt is part of China’s attempt to hit its international commitments on reducing carbon emissions, while also making further improvements in air, water and soil quality.
It is key to note that a major feature of Common Prosperity is more environmentally sustainable growth throughout China. This leads me onto my second reason why future petrochemicals demand growth could be a lot lower than most people expect.
Problem with conventional thinking No2: China wants to reduce the commodity intensity of GDP growth
China wants to reduce the commodity intensity of each percentage point of its GDP growth, both for environmental and debt reasons.
The debt reasons relate to China pouring too much cement and casting too much steel. It has built an excessive number of condos.
So, here are three scenarios for growth in China’s per capita PP consumption from 2022 until 2032.

Translating these per capita outcomes into millions of tonnes of demand, these would be the results.
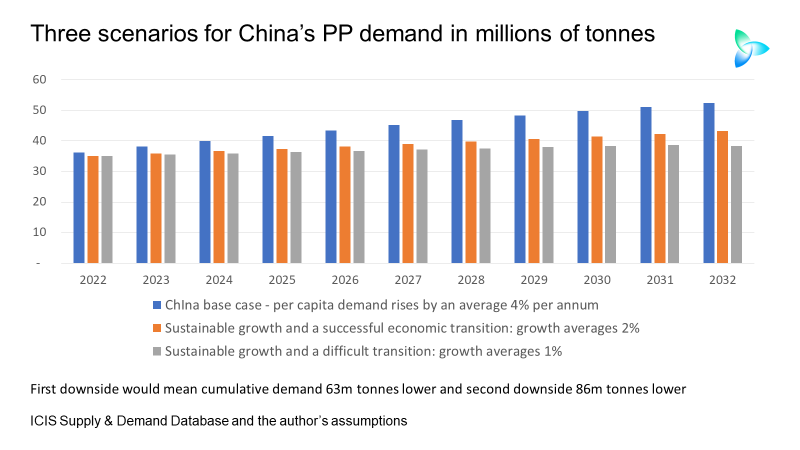
In this shorter than usual post, I would love to hear your arguments why one of the two downides I suggest in the above two charts won’t happen. Contact me via LinkedIn or at john.richardson@icis.com.