
By John Richardson
CONFUSED BY the above chart? Once again I certainly hope so, provided confusion is not followed by blind paralysing panic. The chart, showing three scenarios for China’s net polypropylene (PP) imports in 2021-2031, follows last week’s chart of 2021-2031 high-density polyethylene net imports.
Confusion is valuable because we need to go back the drawing board. We must recognise that some of the old assumptions used to forecast new capacity in China need to be scrapped. And when new assumptions have been built, we must be ready to start all over again as events move forward.
The confusion is the result of Common Prosperity policies being given higher priority by Beijing. We also need to consider the overlapping, and perhaps in some ways contradictory, pressure from Dual Circulation – another government policy framework that includes greater domestic self-reliance.
How will a central tenet of Common Prosperity – reducing carbon emissions – marry with the Dual Control policy greater self-reliance? As a contact said to me last week, “We shouldn’t think, just because sustainability is being given a higher priority, that China has abandoned a policy of greater self-sufficiency from commodity imports in general that began in 2014.
“You can instead even argue that as China turns perhaps a little more inwards because of geopolitical pressures from the US, being less dependent on basic raw material imports may be given an even higher priority,” the contact added.
There is another aspect to this complexity, which is how the provinces interpret and implement directives from Beijing – and how the unintended consequences of central government policies can lead to reverses in direction.
Take the coal shortages as an example. In the second half of 2020, the priority was economic recovery from the pandemic. The provinces responded to the call to boost growth through maximising manufacturing output. There were lots of Western cash-rich middle-class buyers willing to buy Chinese goods.
Then in August this year, the priority switched to making up lost ground on carbon dioxide (CO2) reduction targets under the 14th Five-Year Plan (2021-2024). This is one of many factors behind the coal shortages that have led Beijing to pressure local producers to increase output. We might see a similar state of flux over the criteria for approving new petrochemicals projects.
Now let’s look at the chart at the beginning of this post and explain the rationale behind my estimates of 2021-2031 PP net imports.
Either 63m tonnes of PP net imports in 2021-2031 or net exports of 18m tonnes
Again, let me stress that the chart is meant for demonstration purposes only and is not the kind of completed scenario work you require. For scenarios you can build into your planning process, contact me at john.richardson@icis.com.
Scenario 1 is the base case in the ICIS Supply & Demand Database. It involves none of the 4.2m tonnes/year of PP capacity that we have listed as speculative or unconfirmed going ahead. I am assuming under all three scenarios that this capacity will not happen because of the Common Prosperity drives to reduce CO2 emissions and to make the economy less dependent on heavy industry manufacturing investments.
My first scenario also assumes that 845,000 tonnes/year of confirmed methanol-based PP capacity happens. This is capacity that either starts with local coal converted into methanol then into propylene and finally into PP – or involves importing methanol that is also converted into propylene and PP.
Under Scenario 1, demand growth and the local operating rate average 4% and 82% respectively.
Scenario 2, again, as I said, factors in none of the 4.2m tonnes/year of unconfirmed capacity going ahead.
But I also include cancellation of the 845,000 tonnes/year of confirmed methanol-based capacity. This is because coal-based PP plants are highly CO2 intensive, whereas the plants based on imported methanol tend to be far to the right on cost curves. I have left demand growth and operating rates in Scenario 2 the same as in Scenario 1.
Scenario 3 includes the same outcomes on new capacities as Scenario 2, but lowers demand growth to an average of 2%. This includes growth of 3% in 2021 versus our base case of 7%. The average operating rate is raised to 87%.
I have assumed only 2% growth because in the short term, as China builds a new Common Prosperity economic growth model, Beijing seems to be willing to accept lower economic growth.
Longer term, there is a chance – because of the push towards greater sustainability – that China’s GDP growth will become less dependent on new commodities demand in general. Each percentage point of growth could generate less quantities of new demand for petrochemicals than was the case in the past.
The average actual operating rate between 2000 and 2020 was 92%, so our base case of a rate of 82% in 2021-2031 seems quite low. I have split the difference between 92% and 82% by raising my 2021-2031 by five percentage points to 87% for the following two reasons:
- Coal-to-PP and coal-to-methanol plants tend to drag down overall operating rates because of their economic inefficiencies. No new plants via these routes might therefore increase average capacity utilisation.
- China’s State Council announced a restructuring of the upstream refinery industry on 24 October. This involved capping refinery capacity at about 1bn tonnes/year by 2025, leading to some speculative refinery projects being cancelled. But this is not expected to lead to any shortfalls in PP feedstock – in fact, the reverse- because the State Council also stipulated refineries had to run at an average rate of 80% versus last year’s 75% average. This is expected to lead to plenty of feedstock and high operating rates downstream in PP.
Restructuring the refinery sector is seen as part of the drive for greater economic efficiency. Higher output of refinery products and PP also appear to fit with the Dual Circulation drive for greater self-sufficiency.
The differences in PP net imports by playing around with the numbers in this way are extraordinary. Note that under all three scenarios I have forecast 2021 net imports at 3.4m tonnes, in line with the actual January-September China Customs data:
- Scenario 1 would see net imports in 2022 at 3.7m tonnes, rising to 4.2m tonnes in 2031. Total net imports in 2021-2031 reach 44m tonnes.
- Scenario 2 sees 2022 net imports at 4.6m tonnes. jumping to 6.9m tonnes in 2031. Net imports total 63m tonnes. This shows the big impact of the cancellation of methanol-based projects and base case demand and operating rates remaining unchanged.
- Scenario 3 involves 2022 net imports at just 575,000 tonnes. In 2023, China is in a net export position of 2m tonnes. This rises to 3.3m tonnes in 2031. Across the whole forecast period, China is in a net export position of 18m tonnes.
Diversification to other markets is essential
Remember that in 2020 we estimate that China accounted for 43% of net total global net imports among the countries and regions that imported more than they exported. The chart below details this statistic, along with our industry’s exposure to Chinese imports in other major petrochemicals.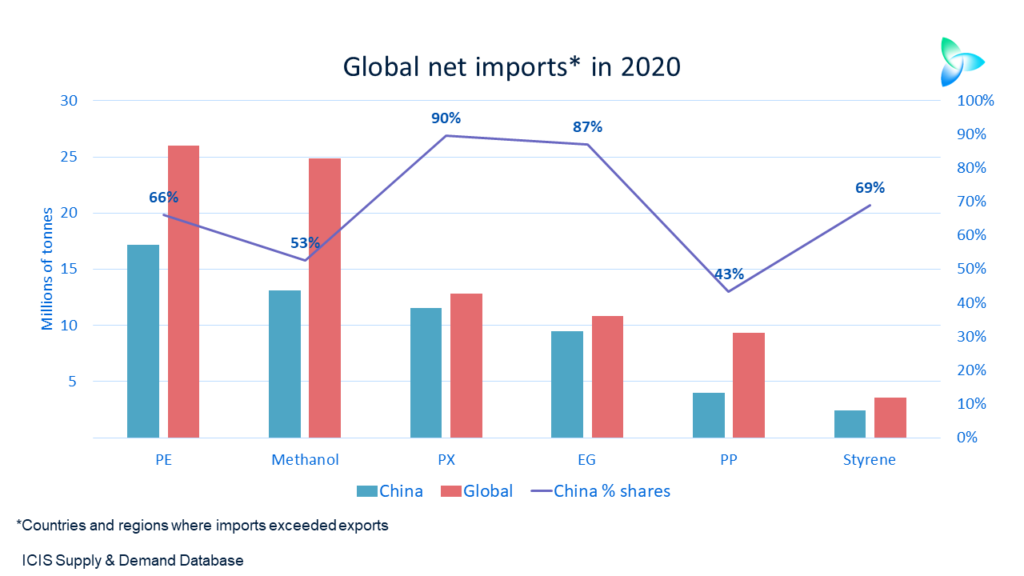
Global export-reliant producers therefore need diversify to hedge against the downside risks surrounding China. (See chart below)
Against the three scenarios for China’s net imports, I have placed our base case estimates for net imports in the other countries and regions. Turkey is a very big opportunity, as you can see, followed by Asia and Pacific, Africa, South and Central America as well as Europe.
Navigating these alternative markets will be nothing new for the big producers; not so, perhaps, for smaller, regional producers in Asia whose reliance on China is big.
Sure, there are plenty of traders out there always willing to take PP resins off the hands of producers to sell anywhere in the world. But without the right data and analysis on current and future prices, supply and demand and margins, producers diversifying from China will be in weak negotiating positions.
Contact me at john.richardson@icis.com and I can explain how we support truly global sales tactics and strategies.