
By John Richardson
THE ABOVE CHART, from the new ICIS Plant Cost Evaluator, underlines the container freight challenges I’ve been highlighting for the Asian petrochemical markets since last year.
How the product works is that polypropylene (PP) capacity to the left of the black line, represented by the green shaded area, is capacity that is operating. Anything beyond the black line is shut down.
(Note that Plant Cost Evaluator covers a range of products across all the major regions.)
The different heights of the green shaded area (if you download the Excel sheet you can see operating costs by individual operators) represent the operating costs of capacity, increasing from left to right.
The black line marks the highest-cost producer still operating. As you know, it is the highest-cost or most-marginal producer operating who sets the price in any given week or month.
Everyone to the left of the line wants to achieve pricing close to that of the marginal producer in order to maximise their profits.
China PP demand continues to decline
Now look at the extraordinarily wide range of potential PP pricing for the period from 26 June until 1 July. The top of the range of potential prices was at $2,733/tonne CFR (cost & freight) Northeast Asia (NEA) with the bottom of the range at just $1,100/tonne CFR NEA.
Bringing this more up to date for the week ended 16 July, ICIS assessed prices between $1,090/tonne and $1,120/tonne CFR main port.
In other words, this was virtually unchanged from the earlier period as the 16 July assessment represented an average price of $1,105/tonne CFR main port achieved in the real market.
This tells us that while the ideal price might have been $2,733/tonne CFR NEA, what was and is being achieved in the region was 60% lower because of the shortages of container freight space.
The shortages were limiting exports to other regions which are sorely needed to relieve oversupply.
Now let us look at the chart below, which makes use of our ICIS Supply & Demand China PP trade data and our local estimates of Chinese PP production.
The chart shows that the decline in PP demand worsened in H1 2021 versus H2 2020. This underlines my argument that the air has been taken out of the H2 2020 China manufacturing export-driven growth bubble.
China’s apparent PP demand in H1 2021 versus H2 2020 (and remember that this the only valid comparison) was down by 6%. This compares with the 5% decline in January-May 2021 versus August-December 2020.
Net imports collapsed to just 1.5m tonnes, largely on a 370% increase of exports to 879,556 tonnes.
This reflects low Asian pricing relative to the rest of the world, the result of the region’s weaker demand and rising supply. Container space is being found, but not enough space was being found to fully relieve oversupply, in my view.
Chinese H1 2021 production was up by 6% over H1 2020 with domestic PP capacity forecast to rise by 26.6% this year.
Around 4.81m tonnes/year of new capacity will come onstream in China in 2021, of which 57% or 2.76m tonnes/year are scheduled to start up in the second half of the year.
This year’s China PP imports look set to fall to 4.4m tonnes from 6.6m tonnes in 2020
In terms of China’s critically important imports (as opposed to net imports which are imports minus exports), the H1 data imply full-year 2021 imports of 4.8m tonnes. This would compare with 6.6m tonnes in 2020.
But, as just mentioned, the majority of new Chinese capacity is due to start up in H2 this year, indicating that 2021 imports could be lower than 4.8m tonnes. I think 2021 imports will fall to around 4.4m tonnes.
China isn’t the only country increasing PP capacity in 2021. New South Korean PP capacity is forecast by ICIS to result in the country moving from a net PP export position of 3m tonnes in 2020 to 3.2m tonnes in 2021.
Malaysia is also forecast to move from a balanced position in 2020 to a small amount of net exports in 2021 because of the restart of the Petronas-Aramco joint-venture plant.
Weaker Chinese demand must, however, be put into the right context which is the purpose of the next chart.
As I’ve been stressing all year, the China slowdown has only been moderate and is relative to what was an abnormally strong year in 2020 because of the pandemic.
China’s PP consumption would still grow by some 300,000 tonnes over last year if the H1 trends continue for the rest of 2021.
But it is important to note that this year’s demand would be 2.2m tonnes lower than our base case for 2021.
Still, if the H1 trends continued, this year’s demand would be 3.1m tonnes higher than in 2019. In other words, China is returning to the Old Normal of pre-pandemic growth.
SEA and the “extreme poverty and “middle income” effects
We must, however, also consider what looks likely to be a second year of negative PP demand growth in southeast Asia (SEA) as this next chart shows.
China is of course not a typical developing economy because of its very developed southern and eastern provinces, which account most of the country’s PP demand.
Consumption in these provinces is therefore very similar to the developed world (see my later comments about developed world consumption and the pandemic).
SEA in contrast consists of typical developing economies other than the fully developed economy of Singapore where demand is very small because of the country’s low population.
The developing world in general will, I believe, see a second consecutive year of petrochemicals demand growth in 2021 because of the “extreme poverty” and “middle income” effects.
The pandemic means that millions of people are being pushed back into extreme poverty or are being denied the chance of escaping extreme poverty.
They will therefore not be able to afford even the most basic of modern-day consumer goods made from petrochemicals.
And many millions more people are being denied the opportunity of moving into middle-income status when motor scooters, washing machines, refrigerators and basic computers and smartphones become affordable.
As far as PP demand is concerned in SEA, our base case assumes 10% growth for the region in 2021 over 2020 as all the countries return to strong growth.
The link between container freight disruptions and vaccination rates
But Indonesia, Malaysia, Thailand and the Philippines are still being badly affected by the pandemic. A recent outbreak in Vietnam also represents a threat.
If these countries saw similar levels of negative growth in 2021 as they did in 2020, this year’s growth would be minus 2%.
Consumption would be 100,00 tonnes lower than in 2020, with this year’s demand 700,000 tonnes lower than our base case for 2021.
The chart below, from the excellent Our World in Data, shows full vaccination levels by country as of 22 July. The lighter the green the lower the vaccination rates and the darker the green the higher were the percentages.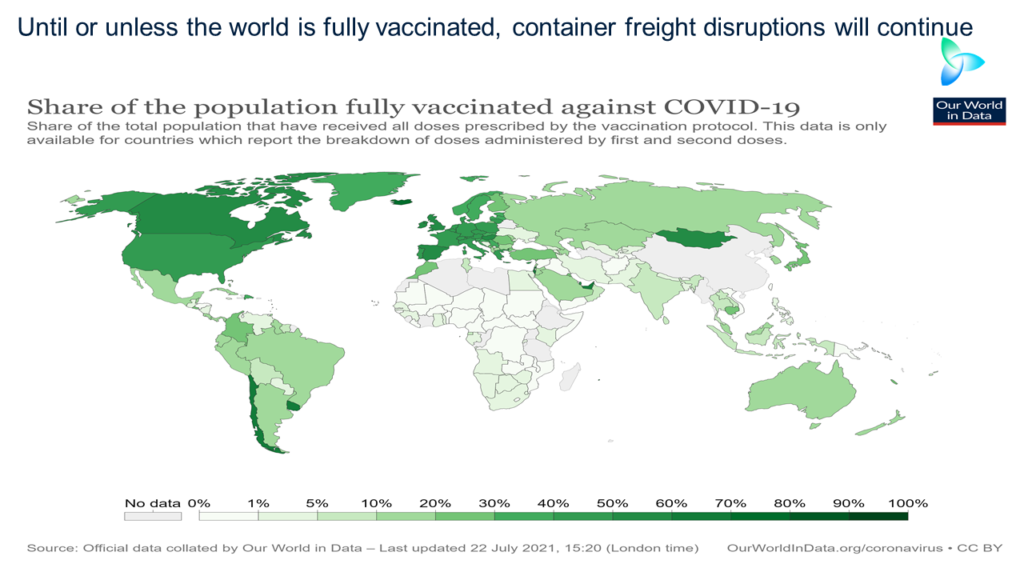
Some standout examples include just 3% of people fully vaccinated in South Africa, Africa’s biggest economy, 6.3% in India and 6.1% in Indonesia – the world’s fourth most populous country. This compares with 48.4% in the US, 53.6% in the UK and 43.9% in Germany.
Until or unless the world is fully vaccinated, and we are a long, long way from this happening, container freight disruptions will continue.
Even more virulent strains than Delta seem likely to incubate in developing countries before spreading across the world, causing more port disruptions.
I believe this leaves container space in tight supply, making it difficult for Asia to move its PP oversupply to other regions.
This leads me onto my next chart.
While Asian demand looks set to remain weak, I believe PP consumption in the developed world will remain strong because of the disconnect between consumption growth and GDP.
Even if the Delta variant slows developed economies, booming hygiene demand, further government stimulus and strong internet sales could well underpin demand.
Assuming that the Delta variant is brought under control, there will in my view be no “Roaring 20s”.
Demand for petrochemicals in general will not boom because of the likelihood that high savings rates will not lead to a spending splurge – and because of the cycle out of spending on some goods into services.
Bu even under downside scenario for developed economies and the Delta strain, PP and other petrochemicals demand will still remain robust because of increased hygiene needs and the long-running shift to greater internet spending.
We must also consider the risks of more PP supply disruptions in the US because of the 60% chance that this year’s US hurricane season will be worse than average – and because of the danger of power outages caused by hot summer weather.
The historically high price differentials that you can see in these charts might well therefore continue, representing a major opportunity for PP buyers outside Asia.
That is unless we see significant PP operating rate cuts in Asia, which leads us onto the final slide today.
Asia is always the least competitive region because of more competition than elsewhere, weaker integration and very limited local hydrocarbon supply.
But as the chart shows detailing integrated variable cost margins, Asian margins have recently been declining as margins have increased in northwest Europe and the US Gulf.
Still, margins in the week ended 16 July were $181/tonne in northeast Asia and $330/tonne in southeast Asia.
This was stronger than their averages in December 2019-early January 2020 when Asia last saw significant rate cuts ($56/tonne in NEA northeast Asia and $118/tonne i SEA southeast Asia).
But what about demand? This takes us back to slide one and the need to constantly monitor the available supply (as supply equals demand) to the left of the black line.
The benefit of operating in Asia is booming demand. So, the further the black line moves to the left, the more likely it is that rate cuts will happen as margins by themselves won’t give you the full story.
Conclusion: our integrated data solution
This gives you just a taste of the integrated data and analysis solutions on offer by ICIS, which includes price benchmarks, price forecasting, our Live Disruption Tracker, our margin assessments and now our recently launched Plant Cost Evaluator.
We can help you make or save an awful lot of money by connecting the dots for you, by putting all this data together and telling you what it means now and what it will mean in the future.