By John Richardson
STATISTICS, if you do not look at them in the right way, can be very misleading. This is the case with last week’s excitement about the growth in China’s June exports of manufactured goods.
On a year-on-year basis, exports grew in dollar terms by 32.2% in June from a year earlier compared with 27.9% growth in May.
This was broadly interpreted as sign that, despite all the logistics problems, China was able to meet strong overseas demand for its electronics, auto components, washing machines and refrigerators etc.
But Louis Kuijs, the head of Asia economics in the Hong Kong office of Oxford Economics, said in a New York Times 13 July article that one-third of the year-on-year increase could be down to rising commodity prices.
Beijing has also allowed China’s currency to strengthen against the US dollar in order to reduce the cost of raw material imports. The yuan had risen in value against the dollar by 0.8% so far this year.
The downside of a stronger yuan is that it is adding upward pricing pressure on exports – along with the surging cost of imported raw materials such as iron ore and crude oil.
More fundamentally, though, it is any year-on-year comparison that is misleading. In both May and June last year, China’s exports had yet to fully recover from their downturn resulting from the pandemic.
Manufacturing supply chains in China were returning to normal last June, but were not entirely back to normal, said petrochemical market sources. The uptick in developed-world demand for Chinese durable exports had also yet to really kick in.
As I’ve been highlighting since last September, it was this boom in exports that led to China’s remarkably strong petrochemicals imports and overall demand growth in 2020.
We can see this from the monthly data on China’s exports from June until December. The big surge in imports didn’t occur until July-November before a slight dip in December.
This “base effect” distortion of the June year-on-year comparison was confirmed by China’s customs administration spokesperson Li Kuiwen.
Li was quoted in various news articles as saying that import growth on a year-on-year basis would likely slow in H2 2021 because of the big growth in imports during the second half of last year.
And to paraphrase an old football joke, last year was a game of two halves. Exports were down by around 40% in H1 2020 versus H2 2019, a contact told me. But H2 2020 exports were up by approximately 80% over H1 2020.
And here is the killer stat, according to the same contact: H1 2021 total exports were around 20% lower than exports in H2 2020. This underlines my argument that relative to the second half of last year, China’s export growth so far in 2021 has lost momentum.
Hold on, though, this is not the end of the world!
It is important that we put the petrochemicals data in the right context.
As I’ve detailed over the last few weeks, demand was down in the five months from January-May 2021 versus August-December 2020 in high-density polyethylene (HDPE), low-density PE (LDPE), linear low-density PE (LLDPE), polypropylene (PP) and styrene monomer (SM).
And as the above chart illustrates, demand for all these products could be down versus 2020 if the January-May trends continue. But consumption would still be higher than the normal pre-pandemic year of 2019.
This tells us that, as things stand right now, the air has been taken out of a Chinese petrochemical growth bubble driven by very strong H2 2020 export growth.
My answers to why exports have slowed so far this year relative to H2 2020 are, I am afraid, only anecdotal (I’ve talked to a small army of contacts) as I don’t have any data.
But what I hear is that China’s export-focused manufacturing plants have struggled to get their goods to market because of the container freight and semiconductor shortages – and because of the shutdown by the Yantai container port complexes in Guangdong during May due to a new outbreak of the pandemic.
It is also being suggested that as lockdown restrictions ease in developed economies, a cycle out of spending on goods and into services could be happening. This means less consumption of game consoles, TVs and washing machines etc, and more consumption of holidays, hotels and rental cars.
But, hey, come on, we still don’t really have a clue. As I’ve again been emphasising since last year, our downstream demand models are wholly inadequate.
This is why we were taken by surprise by the surge in Chinese exports last year and why, whilst we know that the boom has faded, we do not exactly why. We will continue to stumble around in the dark until or unless we build better downstream demand models.
What you need to watch out for during the rest of 2021
It has now been more widely accepted that China’s domestic economy remains weaker than before the pandemic. Independent data analysis has been suggesting this since the start of the year.
As I thought might well be the case, Beijing has responded by relaxing lending conditions.
“China’s central bank said it would lower the amount of funds that banks have to set aside, effectively freeing up $154bn [yuan (CNY) 1tr] for banks to lend,” said the Wall Street Journal on 9 July.
This involves a 0.5 percentage point cut in the central bank’s reserve requirement, the first such cut since April last year, when Beijing was busy stimulating the economy to lessen the impact of the pandemic.
This appears to be yet another case of “back to the future”. On many occasions over the past 13 years, China has relaxed economic reforms when GDP growth has been under threat.
There are hints in the official news media that more domestic measures may occur. But the WSJ suggested in a 14 July article that as GDP growth should reach the official 2021 target of around 6%, further growth measures may not be necessary.
Keep a close eye on the “mood music” of official government statements, the tone of the statements, as an indication of whether further economic stimulus is likely, as well as of course growth in retail sales.
Also keep watching the manufacturing export data. At least from now on, year-on-year comparisons will become more valid as we progress through H2 2021!!
And follow the ICIS China petrochemicals demand data. The January-June apparent demand numbers (China Customs department net import numbers plus our estimates of local production) will be available towards the end of this month.
Also watch what our latest apparent demand numbers mean for likely full-year imports.
The January-May data, as the chart reminds us below, indicate a sharp fall in full-year 2021 PE, PP and SM imports versus 2020. I don’t have to remind you, if you are a reader of the blog, why these declines would have major global significance.
A further key area of analysis – again using ICIS data – are price differentials between China, southeast Asia (SEA) and other regions. The chart below just shows HDPE prices in China and SEA versus Europe. But it is the same story in many different grades and across different regions.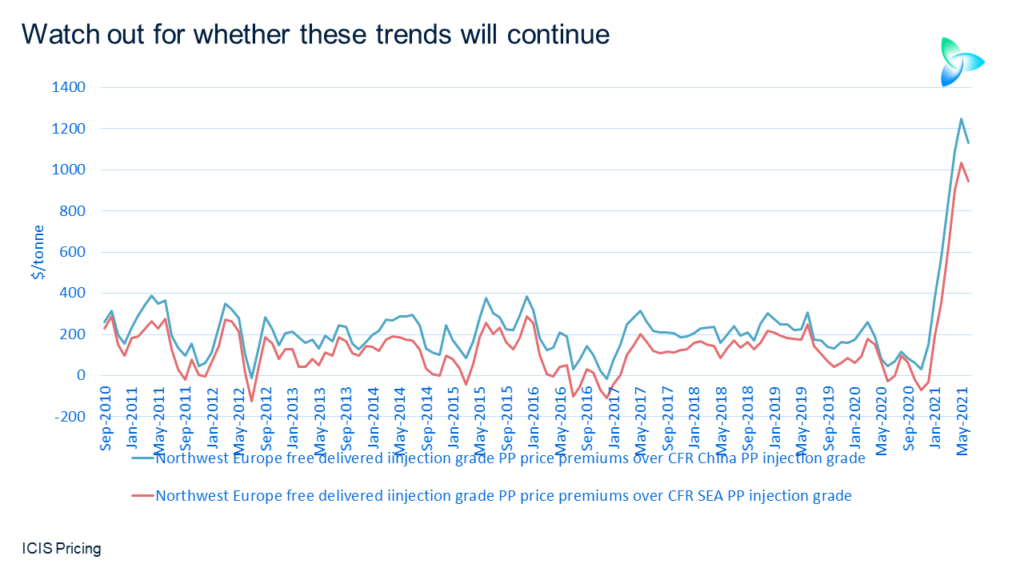
If the price differentials remain as big as they are today (China and SEA have never been as cheap relative to the rest of the world in the 24 years I’ve been analysing this industry), this would point towards the following three influences:
- Continued weakness in Chinese manufacturing exports and the failure of stronger local growth to pick up the slack.
- Weak demand in SEA because of the “extreme poverty” and “middle income” effects that I described last week. I believe that 2021 will see a second consecutive year of negative polyolefins growth in SEA.
- Rising supply as new Chinese, South Korean and Malaysian capacity comes on-stream.
BUT – and this is an important “but” –- as the slide below illustrates using HDPE variable cost margins as an example, China and SEA producers are struggling relative to their peers in other regions. The same applies to LDPE, LLDPE, PP and SM margins.
If margins were to fall any further, we might see operating rate cuts. Our weekly margin products enable you to track the position of Asian producers versus other regions, with our news service providing updates on any rate cuts.
If significant rate cuts were to happen, our pricing services would report any price increases in China and SEA – and how these increases would leave China and SEA versus pricing in other regions.
Conclusion: customised data and analytics solutions
Contact me at john.richardson@icis.com so I can explain how we can put all our data products together for you in a package customised to your needs, combined with analysis from our editors and analysts.
The challenges or huge but so are the opportunities if you have the right visibility on Asian and global markets.